Copyright
©2014 Baishideng Publishing Group Co.
World J Gastroenterol. Jan 28, 2014; 20(4): 888-898
Published online Jan 28, 2014. doi: 10.3748/wjg.v20.i4.888
Published online Jan 28, 2014. doi: 10.3748/wjg.v20.i4.888
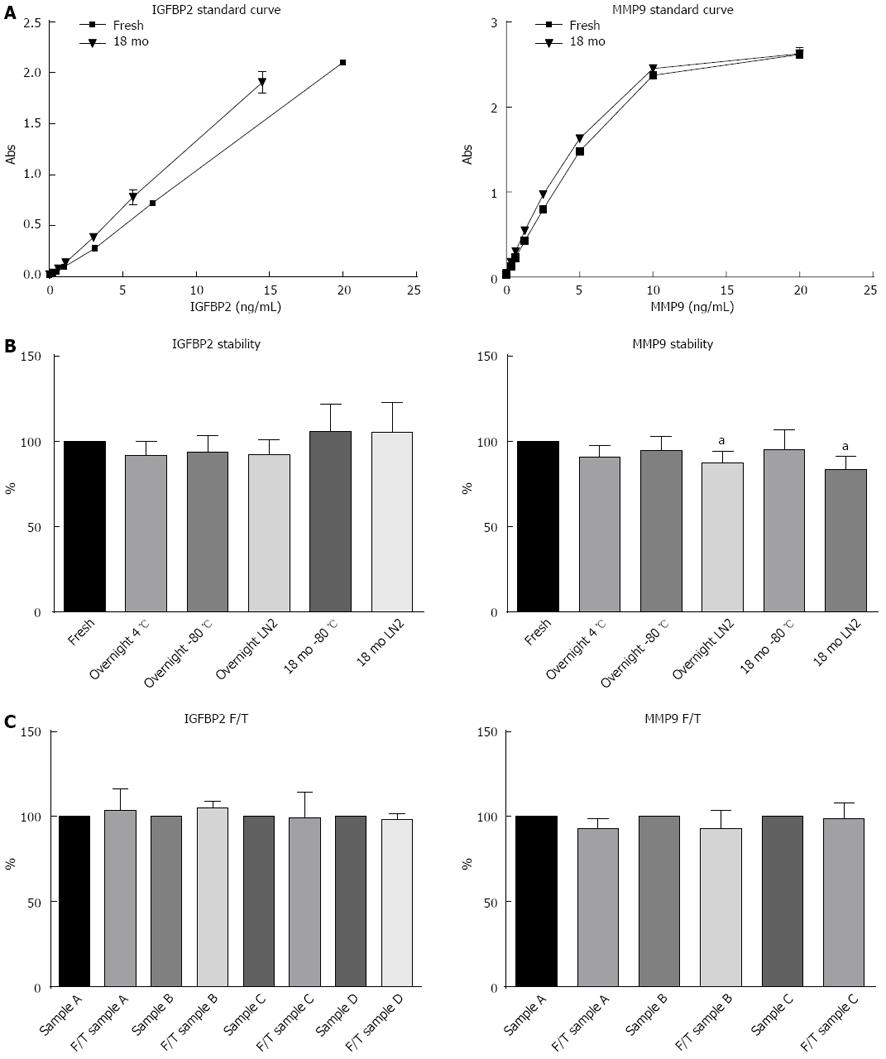
Figure 1 Stability of insulin-like growth factor binding protein 2 and matrix metalloproteinase 9.
A: Standard curves for insulin-like growth factor binding protein 2 (IGFBP2) and matrix metalloproteinase 9 (MMP9) over an 18 mo period indicates that the assays were stable over time; B: IGFBP2 and MMP9 stability after storage for 18 mo in liquid nitrogen and at -80 °C (n = 10 patients); C: Stability of IGFBP2 and MMP9 following three freeze/thaw cycles. All data are represented as average ± standard deviation. F/T: Freeze/thaw cycles. aP < 0.05 when compared to samples measured immediately.
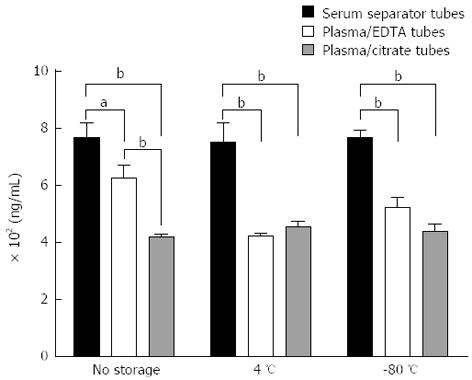
Figure 2 Comparison of insulin-like growth factor binding protein 2 measurements after collection into serum separator tubes, plasma/EDTA tubes and plasma/citrate tubes.
Data are represented as average ± SE of the mean for triplicate measurements. aP < 0.05; bP < 0.01.
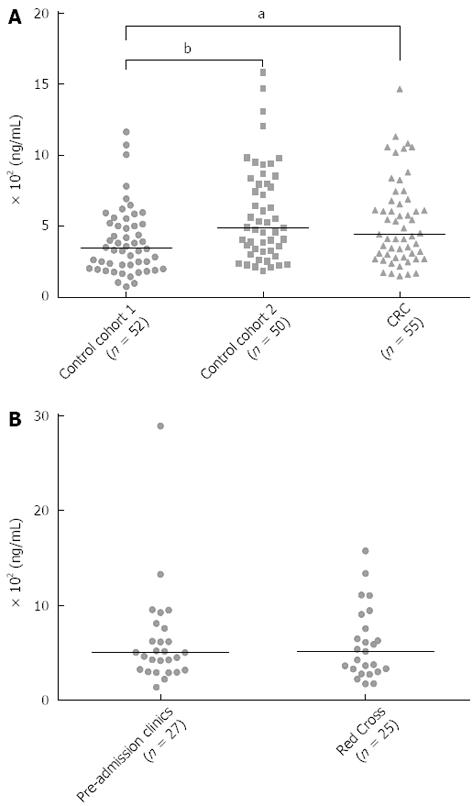
Figure 3 Insulin-like growth factor binding protein 2 measured in different control cohorts and compared to the colorectal cancer patient group.
A: Insulin-like growth factor binding protein 2 (IGFBP2) levels in the sera of patients from two different control cohorts and in a colorectal cancer cohort; B: IGFBP2 levels in the sera of control patients recruited from pre-admission clinics (n = 27) and the Red Cross Blood Donation Centre (n = 25). CRC: Colorectal cancer. aP < 0.05, bP < 0.01 between the median values.
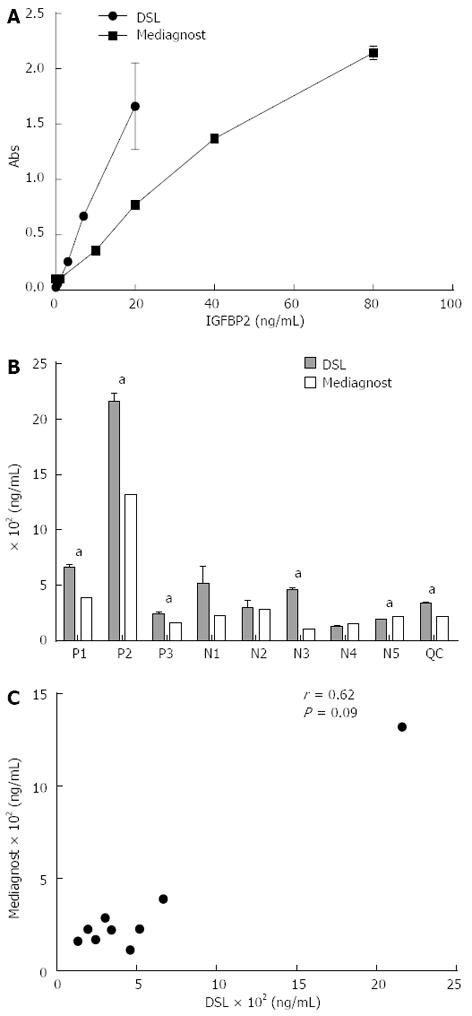
Figure 4 Insulin-like growth factor binding protein 2 measured in patient sera using enzyme-linked immunosorbent assay kits sourced from two different manufacturers.
A: Standard curves for insulin-like growth factor binding protein 2 (IGFBP2) enzyme-linked immunosorbent assays sourced from DSL Inc (Texas, United States) and Mediagnost (Kiel, Germany); B: Comparison of IGFBP2 levels in three colorectal cancer patients (P1-P3), five control patients (N1-N5) and a quality control sample consisting of 10 pooled samples; C: Correlation of measured values of IGFBP2 between the two different manufacturers. The correlation coefficient was 0.62 (Spearman correlation, P > 0.05). Data are represented as average ± standard deviation of three replicate measurements. aP < 0.05.
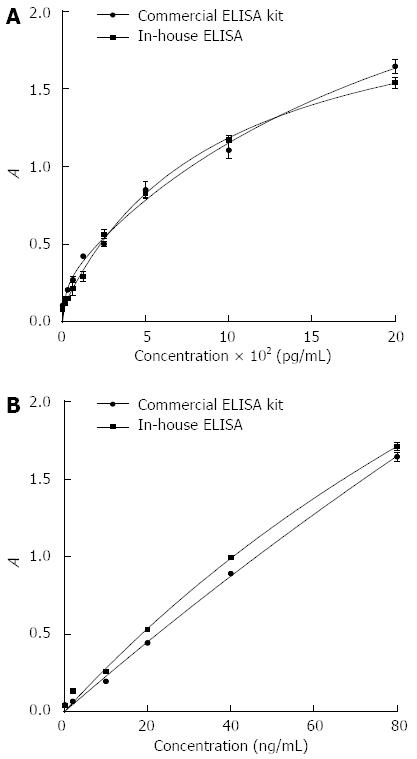
Figure 5 Comparison of calibration curves between commercially available enzyme-linked immunosorbent assay kits and reagents developed in-house for two protein biomarkers.
Data are represented as average ± SE of the mean for two replicate measurements.
- Citation: Fung KY, Nice E, Priebe I, Belobrajdic D, Phatak A, Purins L, Tabor B, Pompeia C, Lockett T, Adams TE, Burgess A, Cosgrove L. Colorectal cancer biomarkers: To be or not to be? Cautionary tales from a road well travelled. World J Gastroenterol 2014; 20(4): 888-898
- URL: https://www.wjgnet.com/1007-9327/full/v20/i4/888.htm
- DOI: https://dx.doi.org/10.3748/wjg.v20.i4.888


