Copyright
©2014 Baishideng Publishing Group Co.
World J Gastroenterol. Jan 28, 2014; 20(4): 1030-1037
Published online Jan 28, 2014. doi: 10.3748/wjg.v20.i4.1030
Published online Jan 28, 2014. doi: 10.3748/wjg.v20.i4.1030
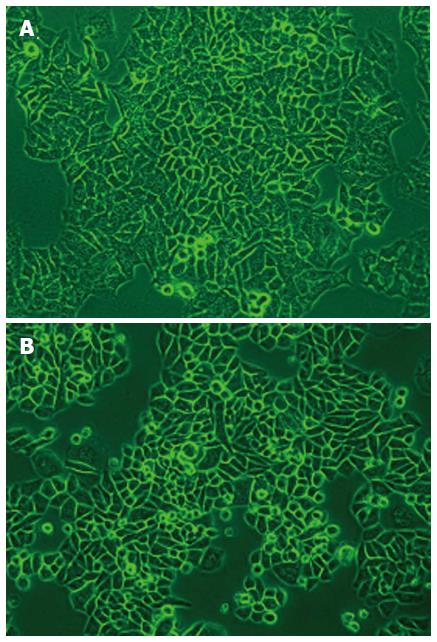
Figure 1 Morphology of human esophageal squamous cell carcinoma cell line CEK-Sq-1.
A: First passage oncogenic cells (× 100); B: After four cycles, the bone-seeking subline CEK-Sq-1BM was harvested.
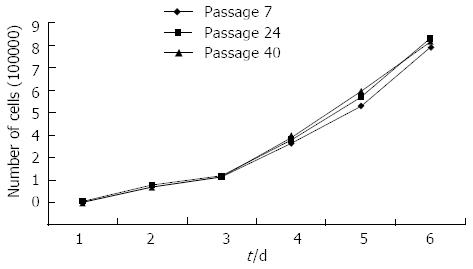
Figure 2 Growth curve of the CEK-Sq-1 cell line at passages 7, 24 and 40.
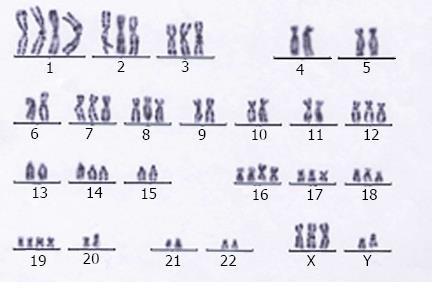
Figure 3 Chromosomal imbalances of CEK-Sq-1 shows the DNA over-representation on chromosomes 1-3, 7, 8, 12, 14, 16–19, X and Y.
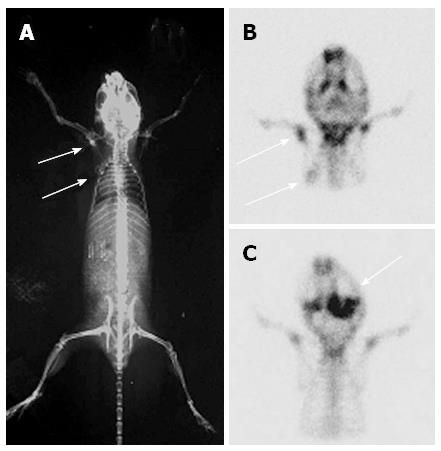
Figure 4 Whole-body X-ray and micro-pinhole bone scintigraphy images of experimental bone metastasis in mice.
A: X-ray image, upper arrow indicates the hot spot of the left humeral osteoblastic metastatic lesion, and the lower arrow indicates the cold spot of the left scapular osteolytic metastatic lesion and circle around the osteogenic reaction; B: Micro-pinhole bone scintigraphy images of the same mouse in the POST position. The osteoblastic metastatic lesion (upper arrow) showed greater accumulation of 99mTc-methylene diphosphonate (99mTc-MDP), and the osteolytic lesion (lower arrow) combined with osteogenic reaction showed less; C: The arrow indicates a mandibular lesion in another mouse with accumulation of 99mTc-MDP.
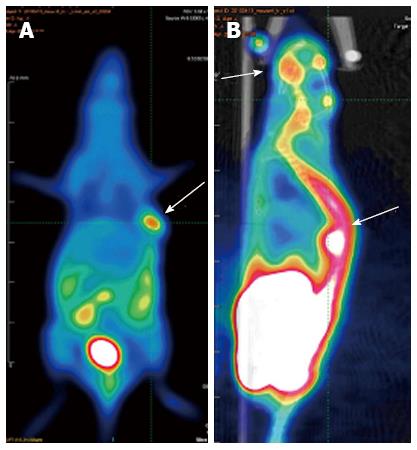
Figure 5 18F-FLT micro-PET/CT images of CEK-Sq-1MB mouse.
A: Arrow indicates 18F-FLT uptake positivity in the cells (2 × 10⁶) injected subcutaneously into the left lateral subcutis of the mouse for 3 wk; B: Arrows indicate the mandibular and thoracic vertebral metastatic lesions of the cells after intracardiac injection in mice for 4 wk.
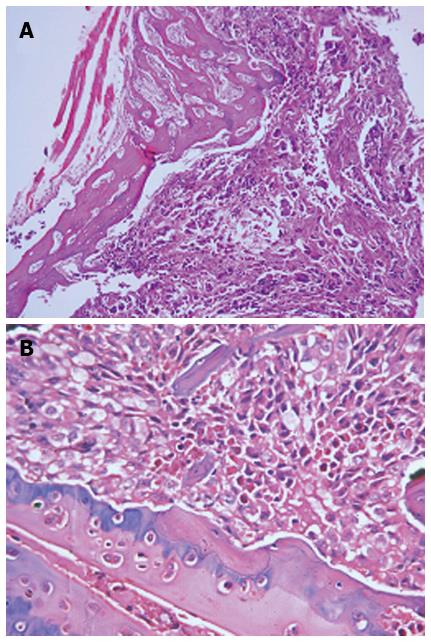
Figure 6 Histological features of the the mandibular (A) (hematoxylin and eosin, ×100) and lumbar vertebral (B) (hematoxylin and eosin, × 200) metastatic lesions.
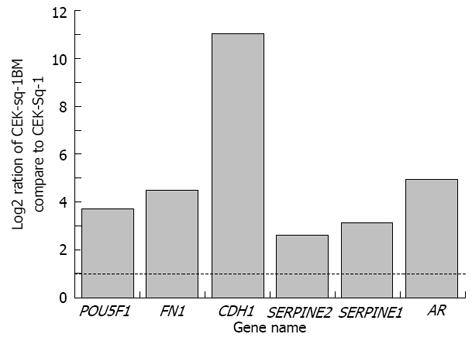
Figure 7 Expression changes of genes determined in CEK-Sq-1BM cells compared with CEK-Sq-1 cells.
- Citation: Zhao BZ, Cao J, Shao JC, Sun YB, Fan LM, Wu CY, Liang S, Guo BF, Yang G, Xie WH, Yang QC, Yang SF. Novel esophageal squamous cell carcinoma bone metastatic clone isolated by scintigraphy, X ray and micro PET/CT. World J Gastroenterol 2014; 20(4): 1030-1037
- URL: https://www.wjgnet.com/1007-9327/full/v20/i4/1030.htm
- DOI: https://dx.doi.org/10.3748/wjg.v20.i4.1030


