Copyright
©2014 Baishideng Publishing Group Inc.
World J Gastroenterol. Oct 14, 2014; 20(38): 14040-14050
Published online Oct 14, 2014. doi: 10.3748/wjg.v20.i38.14040
Published online Oct 14, 2014. doi: 10.3748/wjg.v20.i38.14040
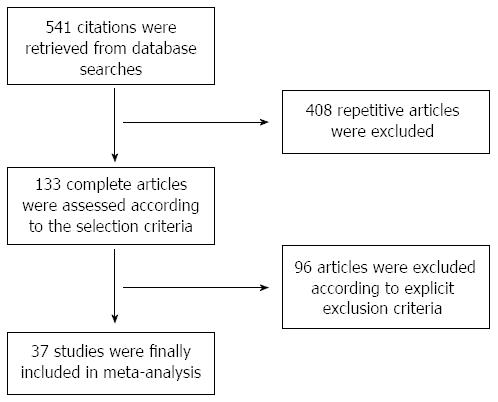
Figure 1 Flowchart of the study selection.
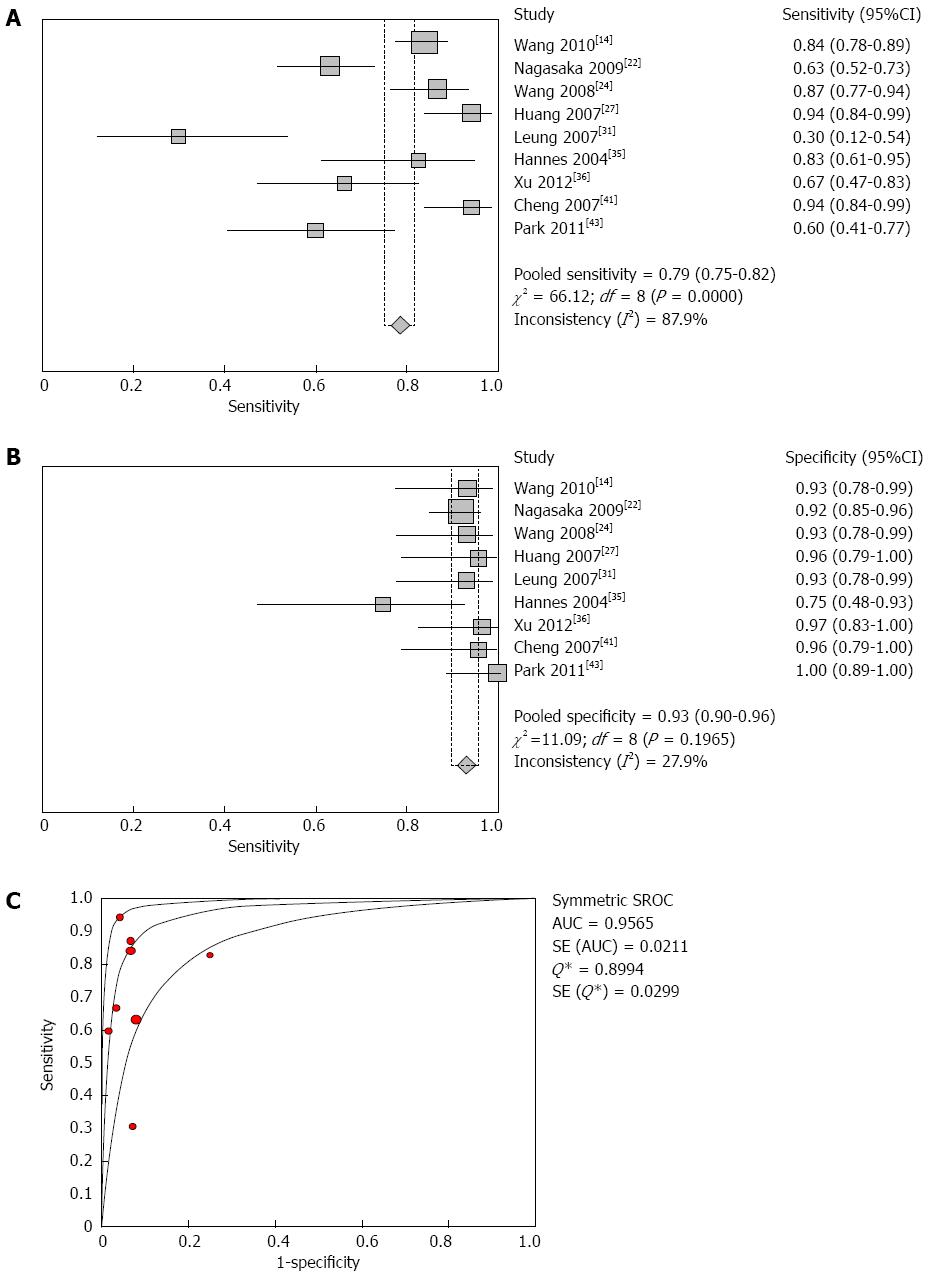
Figure 2 Forest plot of SFRP2 methylation in the diagnosis of colorectal cancer.
A: Shows the sensitivity of SFRP2 methylation in stool samples used for colorectal carcinoma diagnosis. The point estimates of specificity from each study are shown as red squares; B: Shows the specificity of SFRP2 methylation in stool samples used for colorectal cancer diagnosis. The point estimates of specificity from each study are shown as blue squares; C: Shows the summary receiver operating characteristic curves (SROC) of SFRP2 methylation assays used for diagnosis of colorectal carcinoma. Red circles represent each study that was included in the meta-analysis. The size of each study is indicated by the size of the red circle. SROC curves summarize the overall diagnostic accuracy. Error bars indicate the 95%CI, and df indicates the degrees of freedom.
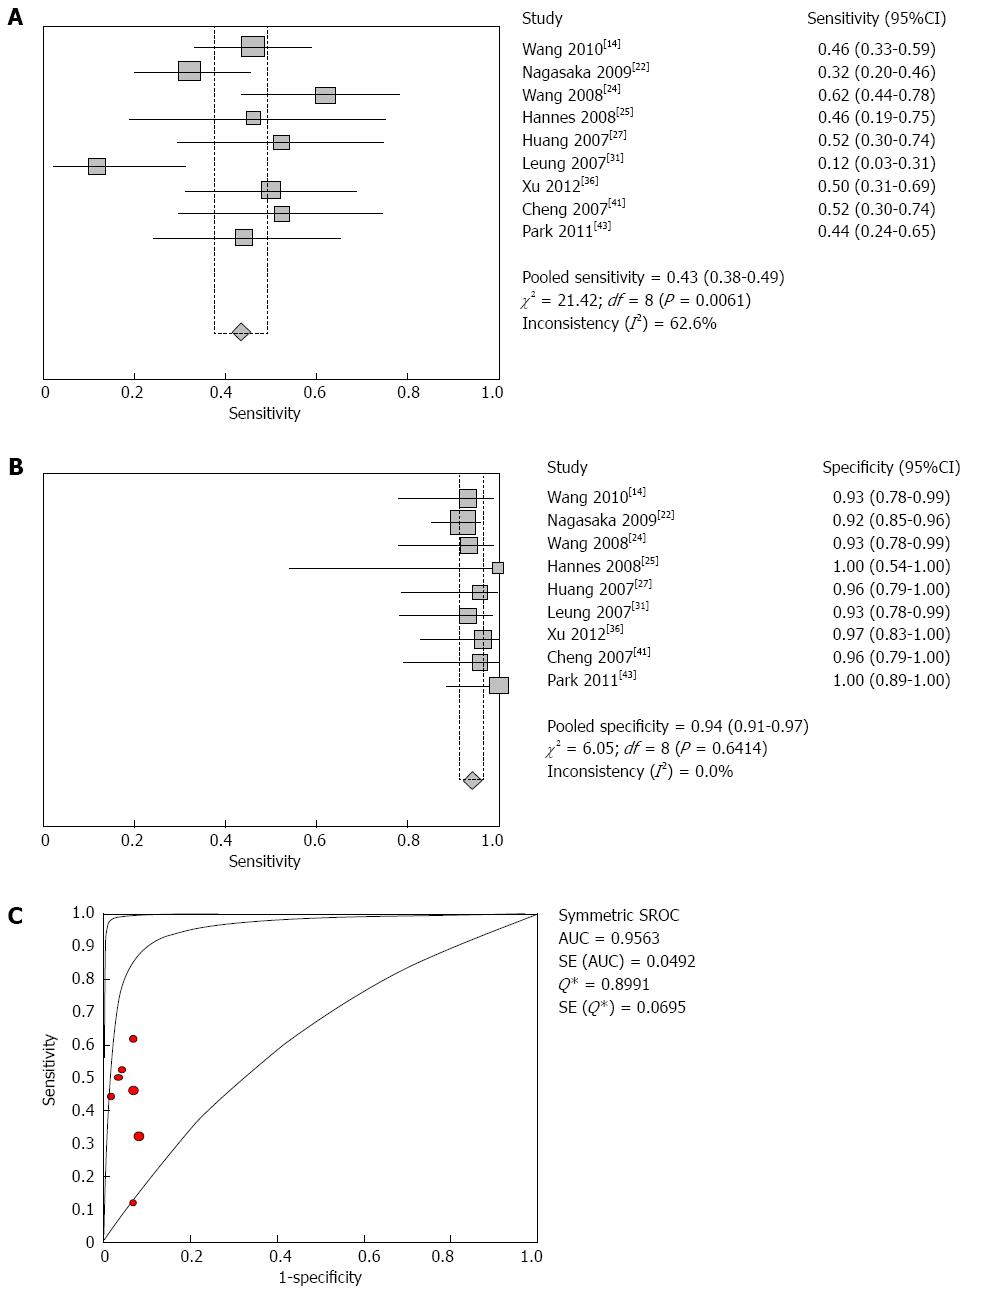
Figure 3 Forest plot of SFRP2 methylation in the diagnosis of colorectal adenomas.
A: Shows the sensitivity of SFRP2 methylation in stool samples for colorectal adenoma diagnosis; B: Shows the specificity of SFRP2 methylation in stool samples for colorectal adenoma diagnosis; C: Shows the summary receiver operating characteristic curves (SROC) of SFRP2 methylation assays for the diagnosis of colorectal adenomas.
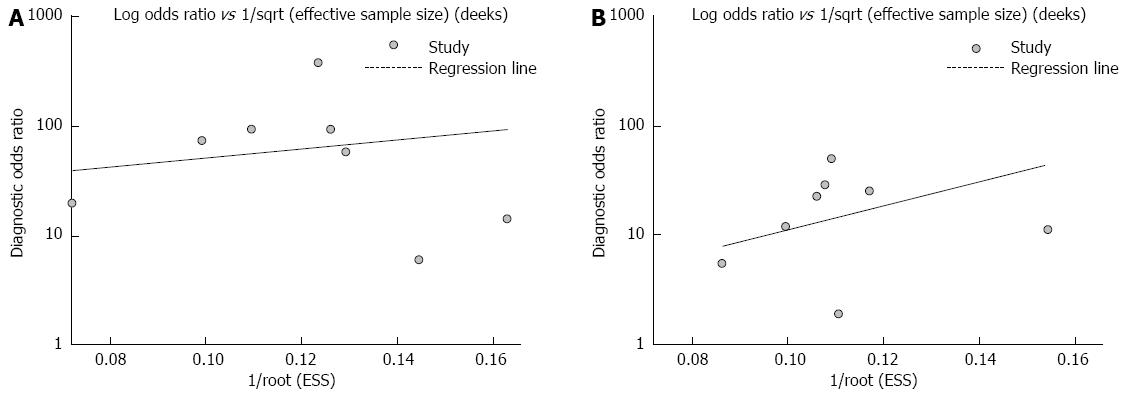
Figure 4 Assessment of the publication bias in faecal SFPR2 methylation for the diagnosis of colorectal cancer (A) and adenomas (B).
No significant publication biases were found in any of these studies (all P > 0.05).
- Citation: Zhang H, Qi J, Wu YQ, Zhang P, Jiang J, Wang QX, Zhu YQ. Accuracy of early detection of colorectal tumours by stool methylation markers: A meta-analysis. World J Gastroenterol 2014; 20(38): 14040-14050
- URL: https://www.wjgnet.com/1007-9327/full/v20/i38/14040.htm
- DOI: https://dx.doi.org/10.3748/wjg.v20.i38.14040


