Copyright
©2014 Baishideng Publishing Group Inc.
World J Gastroenterol. Oct 14, 2014; 20(38): 13911-13919
Published online Oct 14, 2014. doi: 10.3748/wjg.v20.i38.13911
Published online Oct 14, 2014. doi: 10.3748/wjg.v20.i38.13911
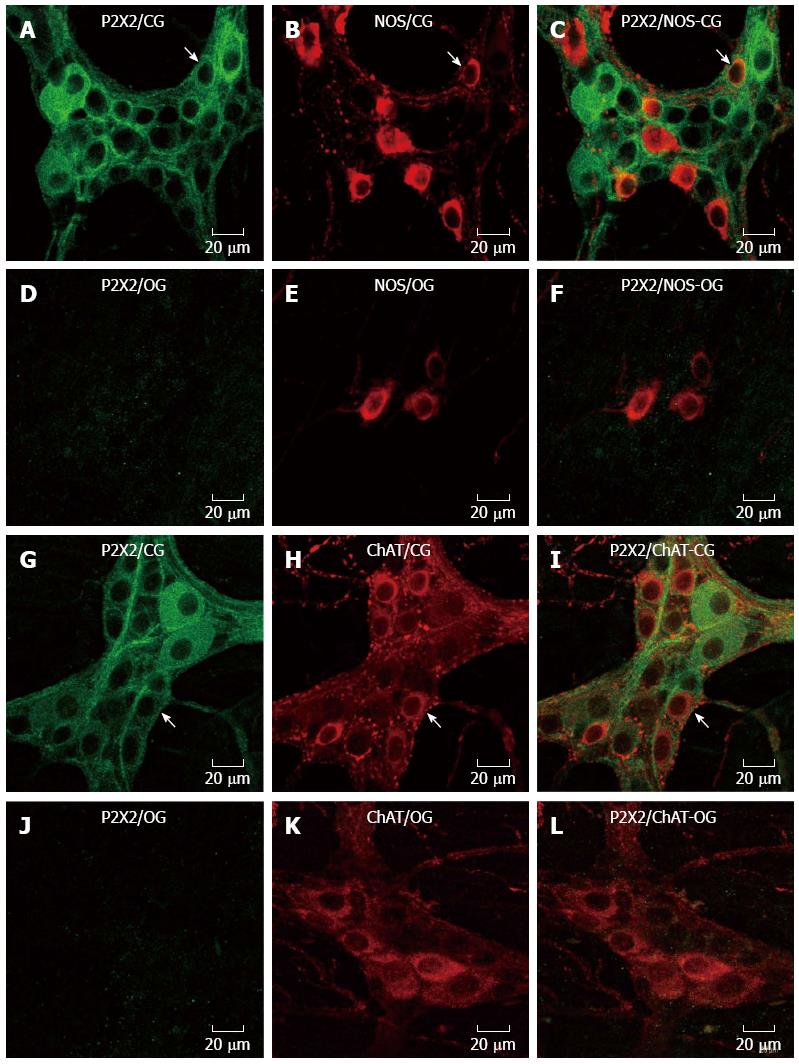
Figure 1 Examination of immunoreactivity for the P2X2 receptor, nitric oxide synthase and choline acetyl transferase.
Immunoreactivity for the P2X2 receptor (A, G), NOS (B, E), and ChAT (H, K) was examined in myenteric plexus neurons from the control group (CG) (A-C, G-I) and the obese ob/ob group (OG) (D-F, J-L). Merged images are show in C, F, I and L. Single arrows show the double-labeled P2X2 receptor and NOS-ir neurons in the CG (A-C) and OG (D-F). Double-labeling for P2X2 and ChAT in CG (G-I) and OG (J-L) neurons is indicated by arrows. Note that the P2X2 receptor did not label myenteric neurons in the OG (D, J). NOS: Nitric oxide synthase; ChAT: Choline acetyl transferase.
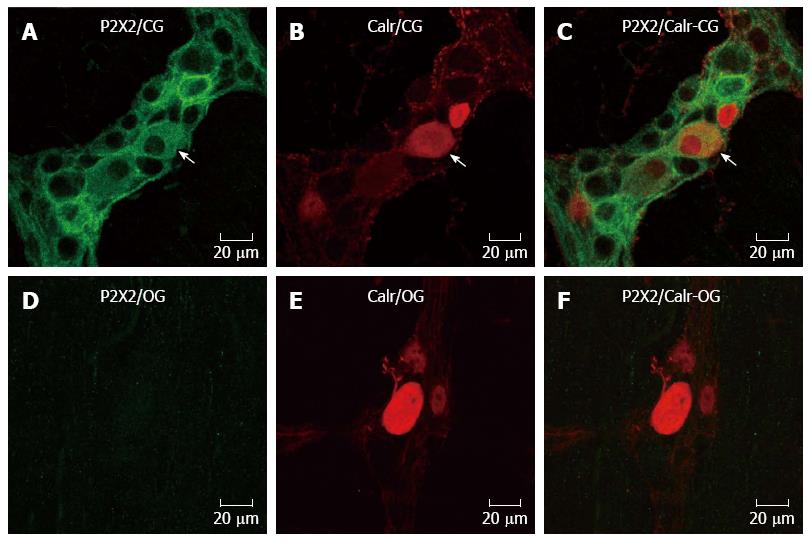
Figure 2 Examination of immunoreactivity for the P2X2 receptor and calretinin.
Immunoreactivity for the P2X2 receptor (A, C) and calretinin (Calr) (B, C, E, F) was examined in myenteric plexus neurons from the control group (CG) (A-C) and the obese ob/ob group (OG) (D-F). Single arrows show the double-labeled P2X2 receptor and calretinin-ir neurons in the CG (A-C). Note that the P2X2 receptor did not label myenteric neurons in the OG (D, F).
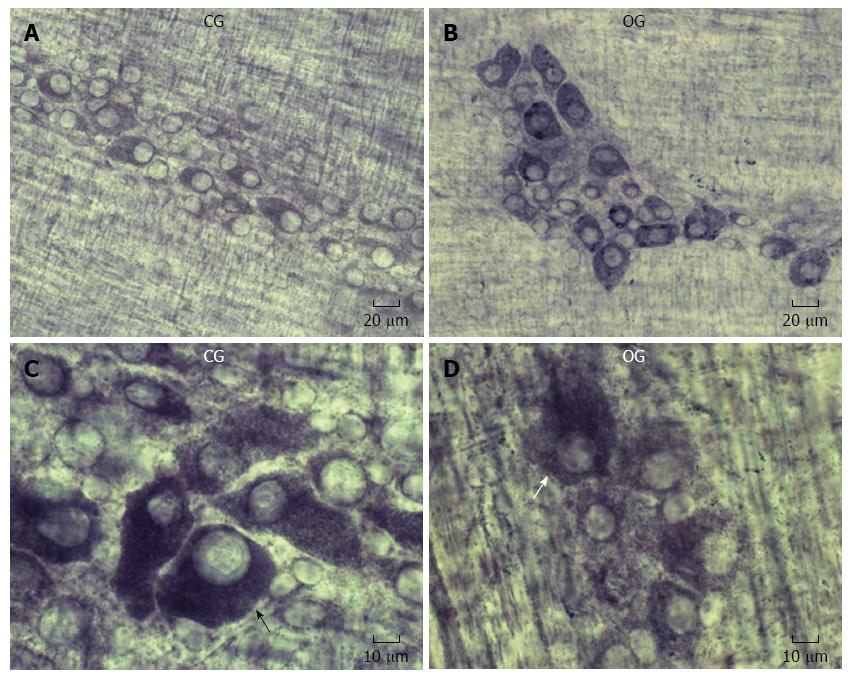
Figure 3 Ileal myenteric neurons labeled for nicotinamide adenine dinucleotide-diaphorase activity in the control group (A, B) and the obese group (C, D).
Arrows show stained myenteric neurons. CG: Control group; OG: Obese group.
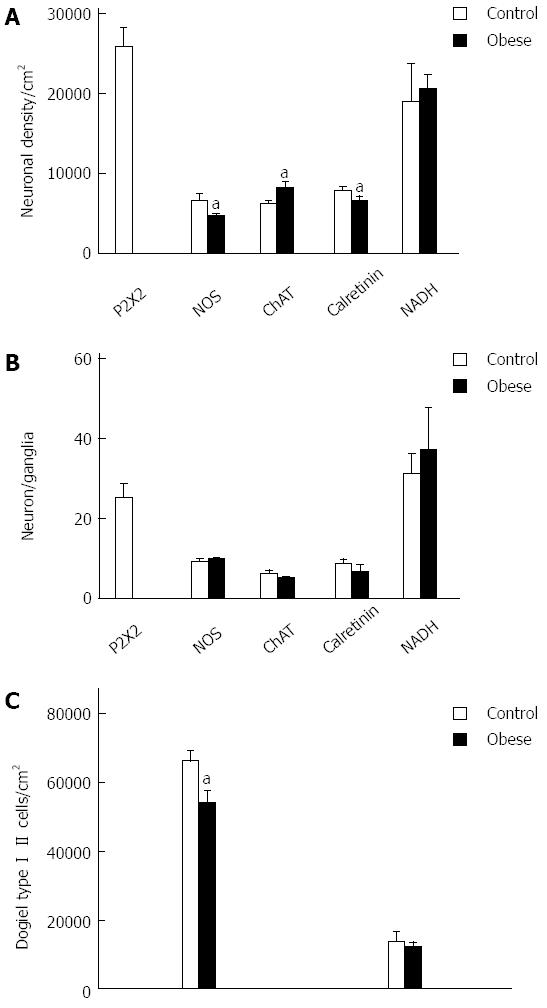
Figure 4 Neuronal density and number of neurons per ganglion.
Neuronal density (neurons/cm2) (A), neurons per ganglion (B) immunoreactive for the P2X2 receptor, nitric oxide synthase (NOS), acetyltransferase (ChAT), and calretinin and positive for nicotinamide adenine dinucleotide-diaphorase (NADH) activity in the ileum myenteric plexus, and the densities of Dogiel Type I and II neurons immunoreactive for calretinin (C) in control and obese mice are shown. aP < 0.05 vs control, mean ± SE, Student’s t-test.
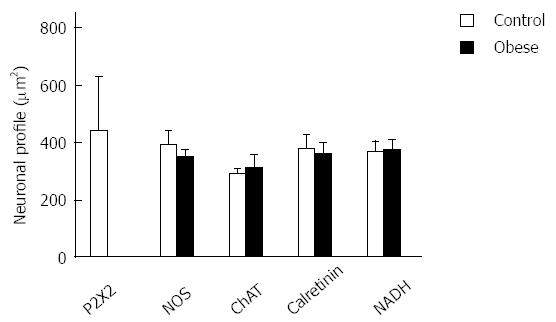
Figure 5 Neuronal size.
Cell body profile areas (μm2) of neurons immunoreactive for the P2X2 receptor, nitric oxide synthase (NOS), choline acetyltransferase (ChAT), and calretinin and positive for nicotinamide adenine dinucleotide-diaphorase (NADH) activity in the ileum myenteric plexus of control and male obese mice are shown. Mean ± SE, Student’s t-test.
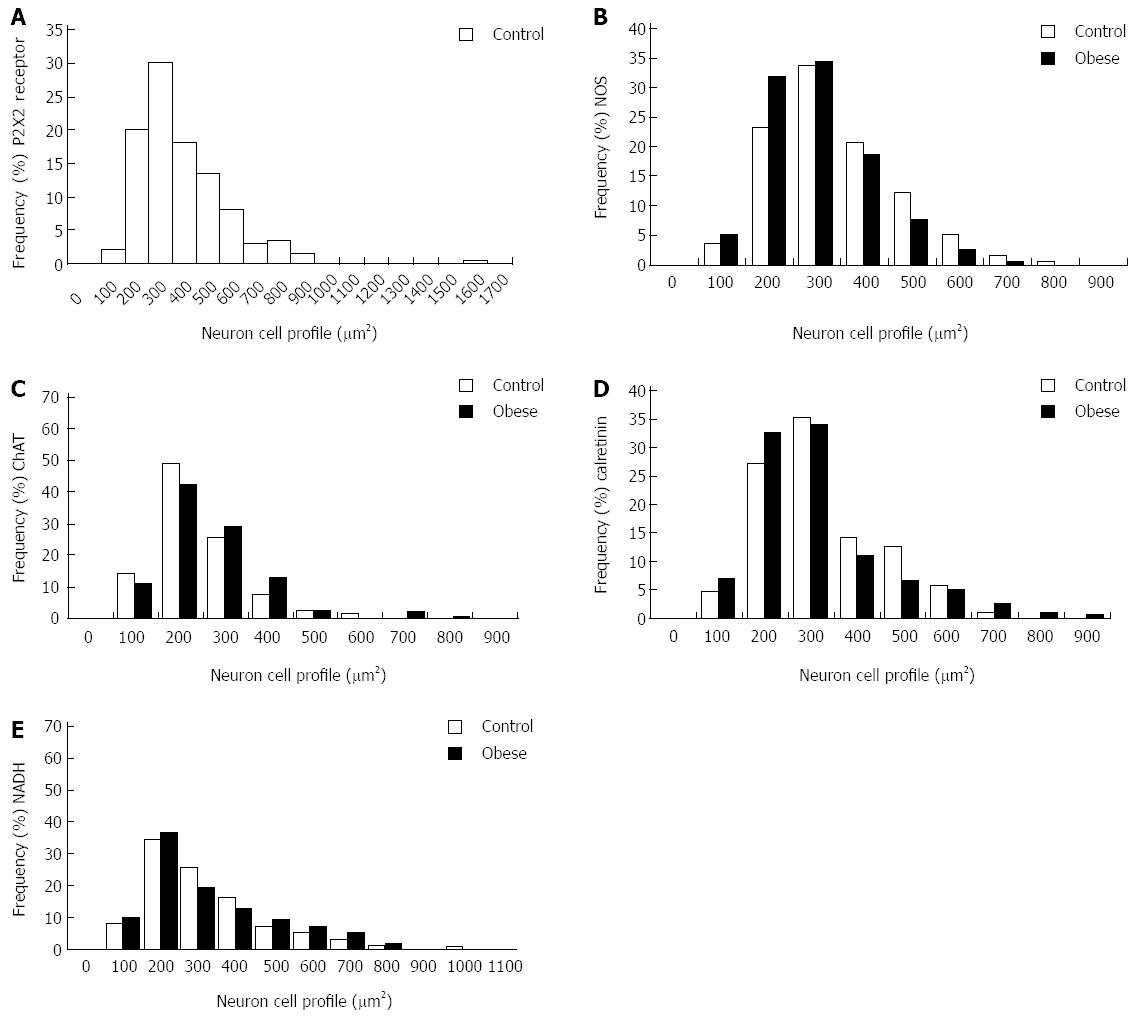
Figure 6 Size distributions of myenteric neurons of the control group and obese group.
Frequency distributions of neuronal size profiles (μm2) for neurons immunoreactive for the P2X2 receptor (A), nitric oxide synthase (NOS) (B), choline acetyltransferase (ChAT) (C), and calretinin (D) and positive for nicotinamide adenine dinucleotide-diaphorase (NADH) (E) activity in the ileum myenteric plexus of control (white bars) and obese (black bars) male mice are shown.
-
Citation: Mizuno MS, Crisma AR, Borelli P, Schäfer BT, Silveira MP, Castelucci P. Distribution of the P2X2 receptor and chemical coding in ileal enteric neurons of obese male mice (
ob/ob ). World J Gastroenterol 2014; 20(38): 13911-13919 - URL: https://www.wjgnet.com/1007-9327/full/v20/i38/13911.htm
- DOI: https://dx.doi.org/10.3748/wjg.v20.i38.13911


