Copyright
©2014 Baishideng Publishing Group Inc.
World J Gastroenterol. Oct 7, 2014; 20(37): 13521-13529
Published online Oct 7, 2014. doi: 10.3748/wjg.v20.i37.13521
Published online Oct 7, 2014. doi: 10.3748/wjg.v20.i37.13521
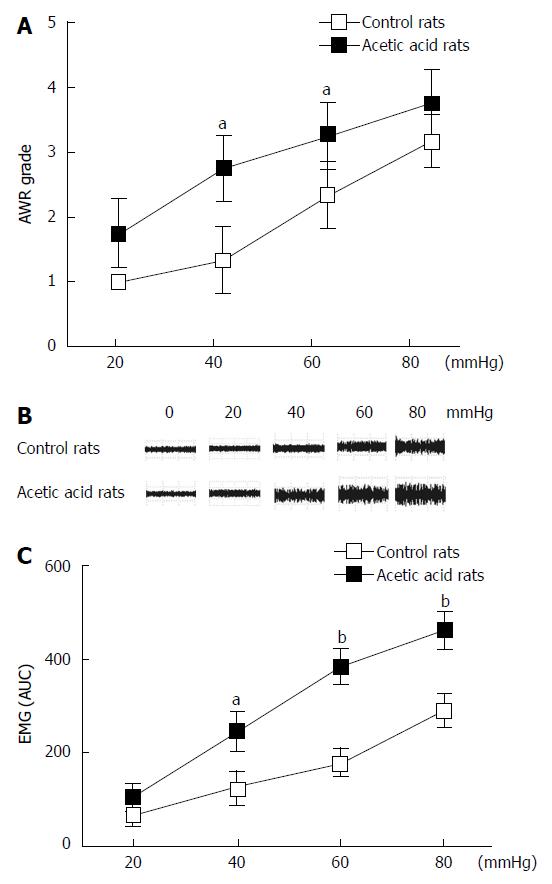
Figure 1 Effect of neonatal acetic acid treatment on 8-wk-old rat sensitivity to colorectal distension.
A: Abdominal withdrawal reflex (AWR) responses to the graded pressures of colorectal distension (CRD) in saline-treated (n = 10) and acetic acid-treated (n = 10) rats. Acetic acid-treated rats show increased AWR scores compared with the saline rats. Values are expressed as mean ± SD; B: Representative electromyogram (EMG) traces recorded in control and acetic acid-treated rats in response to CRD; C: EMG responses to CRD in rats treated with saline and acetic acid at the neonatal stage. Similar to the AWR scores, acetic acid-treated rats exhibited exaggerated EMG activity responses to CRD at different pressures compared with the saline-treated rats. Neonatal rats vs control rats, aP < 0.05, bP≤ 0.01, error bars represent the mean ± SD.
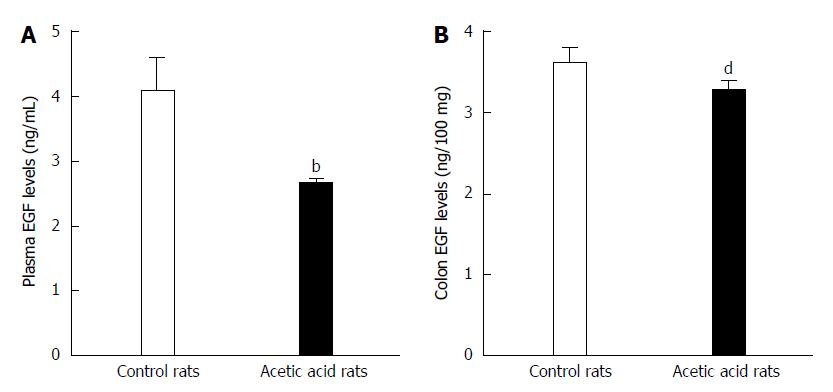
Figure 2 Epidermal growth factor levels in plasma and colon tissue of the visceral-sensitized rats.
A: Plasma epidermal growth factor (EGF) levels were significantly lower in visceral-sensitized rats than in controls (visceral hypersensitive group rats vs control group rats, bP < 0.01); B: EGF levels in colon were significantly lower in visceral-sensitized rats than in controls (visceral-sensitized rats vs control rats, dP < 0.01). Error bars represent the mean ± SD (n = 10 in each group).
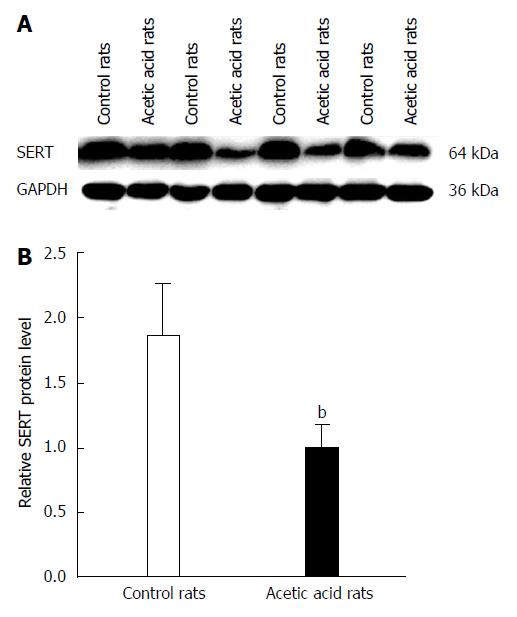
Figure 3 Serotonin transporter levels in colon tissues of control and visceral-sensitized rats.
A: Western blot of serotonin transporter (SERT) expression in colonic tissues in both acetic acid- and saline-treated rat groups; B: Quantitation of SERT protein in rat colonic tissue in both acetic acid- and saline-treated rat groups compared to GAPDH. The SERT protein expressions in colon tissues were significantly lower in visceral-sensitized rats than in the controls (visceral-sensitized rats vs controls, bP < 0.01) (n = 10 in each group).
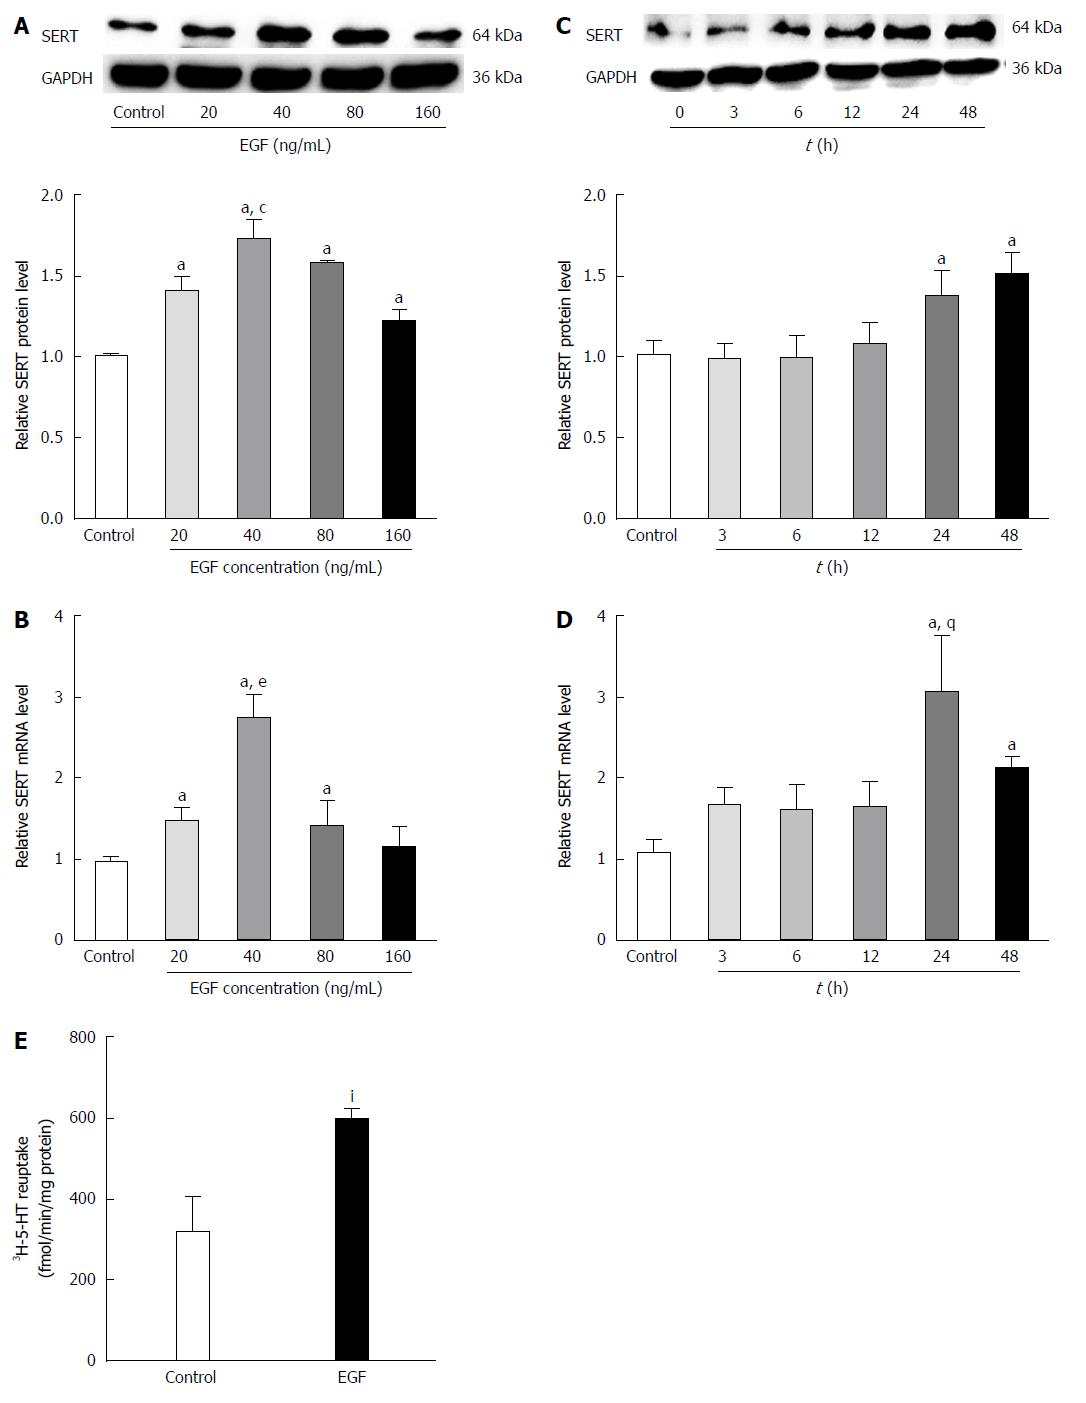
Figure 4 Effects of epidermal growth factor on serotonin transporter in rat intestinal epithelial cells.
Intestinal epithelial cells (IEC-6) cells were treated with epidermal growth factor (EGF) (0, 20, 40, 60, and 80 ng/mL) for 24 h. A: Western blots were performed to detected serotonin transporter (SERT) protein expressions. GAPDH was used to verify equivalent protein loading (aP < 0.05 vs control; cP < 0.05 vs 20, 80, and 160 ng/mL); B: SERT gene expression was examined by real-time PCR (aP < 0.05 vs control; eP < 0.05 vs 20 and 80 ng/L). To determine the optimal time for EGF treatment, IEC-6 cells were treated with EGF (40 ng/L) for the indicated times (0, 3, 6, 12, 24, and 48 h); C: SERT protein levels were examined by Western blot (aP < 0.05 vs control); D: SERT gene expression was examined by real-time PCR (aP < 0.05 vs control; gP < 0.05 vs 48 h); E: Uptake of [3H]-serotonin in cells pre-treated with 40 ng/ml EGF for 24 h (IP < 0.05 vs 24 h) . All values are mean ± SD of three independent experiments.
Figure 5 Role of epidermal growth factor receptor in the regulation of serotonin transporter levels and function in intestinal epithelial cells.
IEC-6 cells were pre-treated with an epidermal growth factor receptor (EGFR) inhibitor (10 μmol/L PD153035) prior to stimulation with epidermal growth factor (EGF). A: Serotonin transporter (SERT) was detected by Western blot (aP < 0.05 vs control, EGF + PD153035, and PD153035) and quantified relative to GAPDH; B: Serotonin (5-HT) reuptake was estimated by an [3H]-5-HT uptake assay. Data are mean ± SD of at least three independent experiments.
- Citation: Cui XF, Zhou WM, Yang Y, Zhou J, Li XL, Lin L, Zhang HJ. Epidermal growth factor upregulates serotonin transporter and its association with visceral hypersensitivity in irritable bowel syndrome. World J Gastroenterol 2014; 20(37): 13521-13529
- URL: https://www.wjgnet.com/1007-9327/full/v20/i37/13521.htm
- DOI: https://dx.doi.org/10.3748/wjg.v20.i37.13521


