Copyright
©2014 Baishideng Publishing Group Inc.
World J Gastroenterol. Oct 7, 2014; 20(37): 13325-13342
Published online Oct 7, 2014. doi: 10.3748/wjg.v20.i37.13325
Published online Oct 7, 2014. doi: 10.3748/wjg.v20.i37.13325
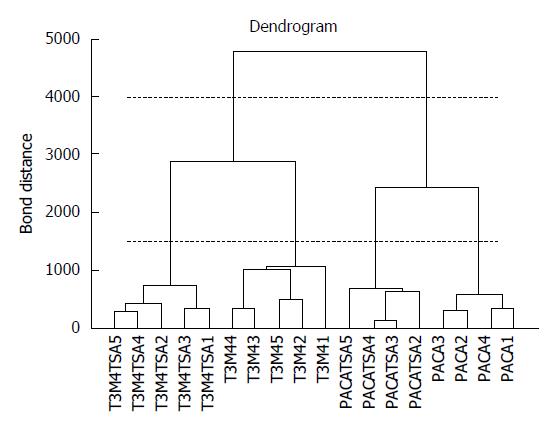
Figure 1 Example of a dendrogram built using Ward’s linkage method and euclidean distances.
Data refer to samples from two pancreatic cancer cell lines treated or not with trichostatin A.
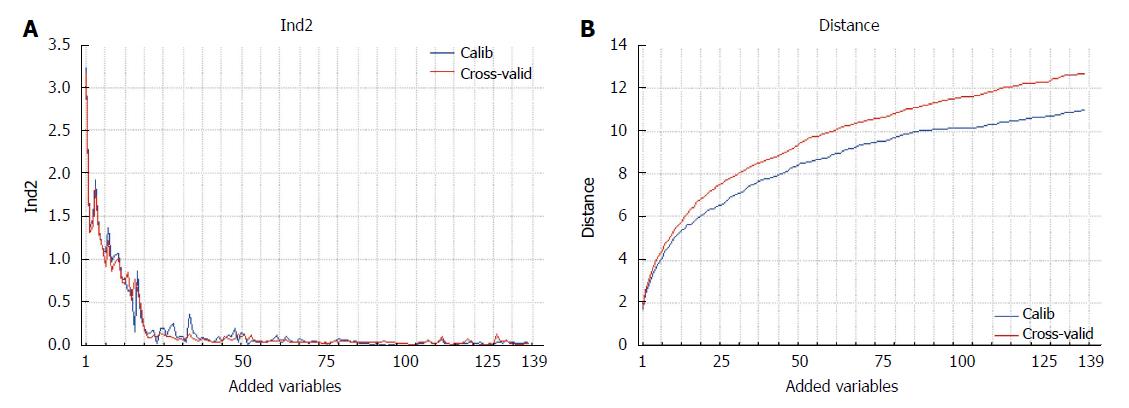
Figure 2 Example of the graphical representation of the results from Ranking-PCA.
Trend of Ind2vs the increasing number of variables added to the model (A); trend of the distance between the two class centroids vs the number of variables added to the model (B). Variables on the X-axis are reported in the order in which they are included in the model. Both calibration and cross-validation results are reported.
- Citation: Marengo E, Robotti E. Biomarkers for pancreatic cancer: Recent achievements in proteomics and genomics through classical and multivariate statistical methods. World J Gastroenterol 2014; 20(37): 13325-13342
- URL: https://www.wjgnet.com/1007-9327/full/v20/i37/13325.htm
- DOI: https://dx.doi.org/10.3748/wjg.v20.i37.13325


