Copyright
©2014 Baishideng Publishing Group Inc.
World J Gastroenterol. Sep 21, 2014; 20(35): 12649-12656
Published online Sep 21, 2014. doi: 10.3748/wjg.v20.i35.12649
Published online Sep 21, 2014. doi: 10.3748/wjg.v20.i35.12649
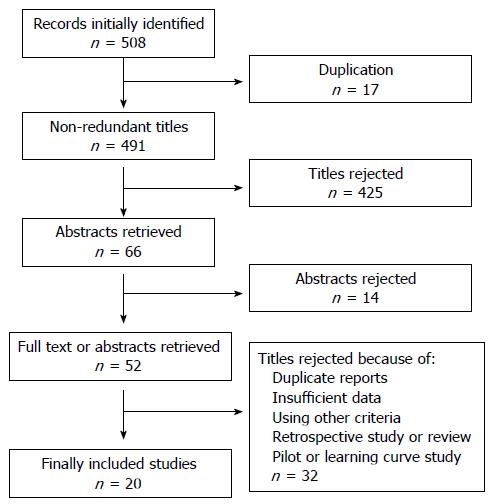
Figure 1 Flow chart describing the process of study selection.
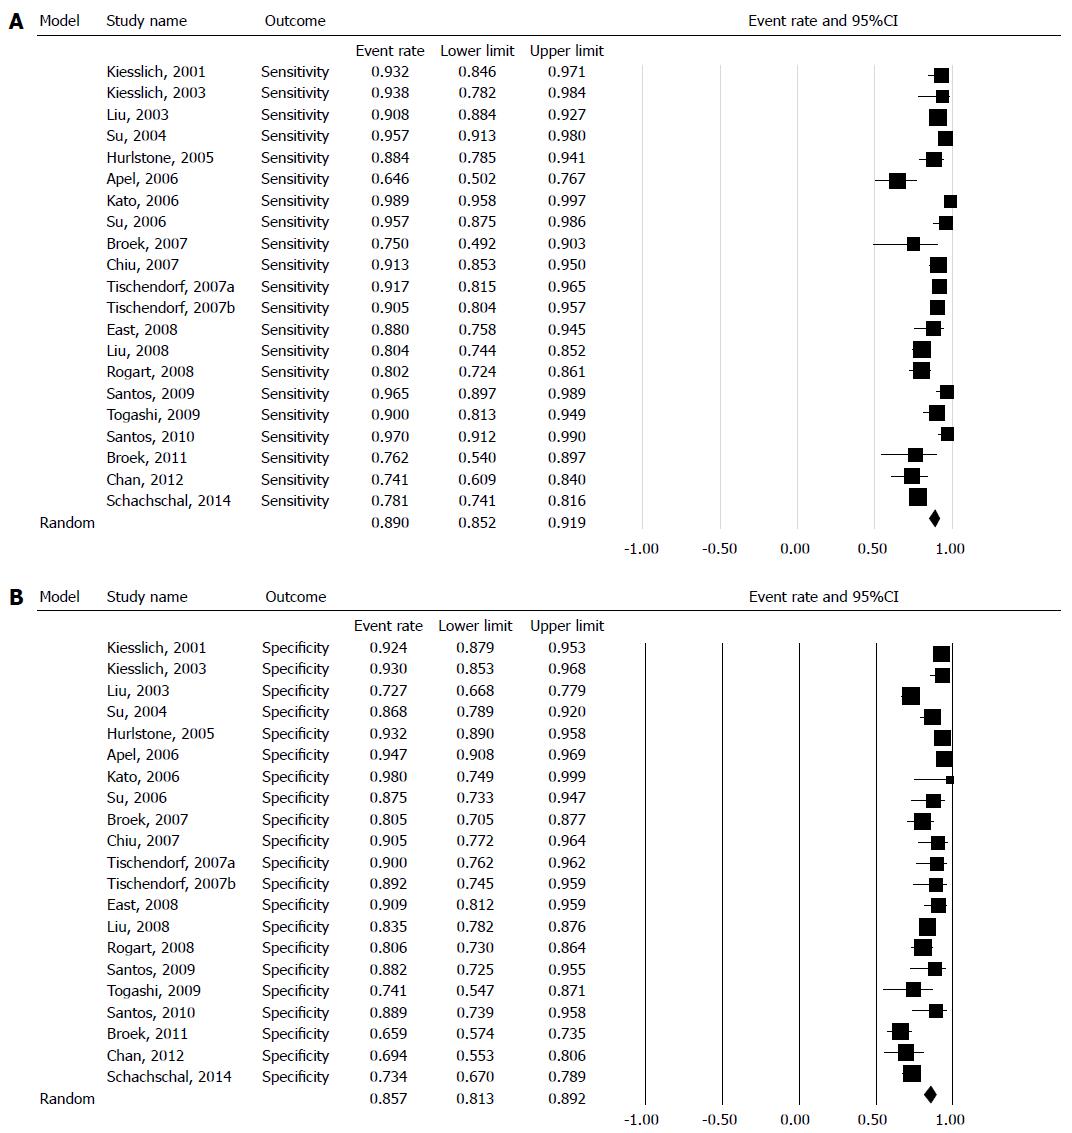
Figure 2 Forest plot showing the sensitivity (A) and specificity (B), with 95%CI, for diagnosing neoplastic polyps.
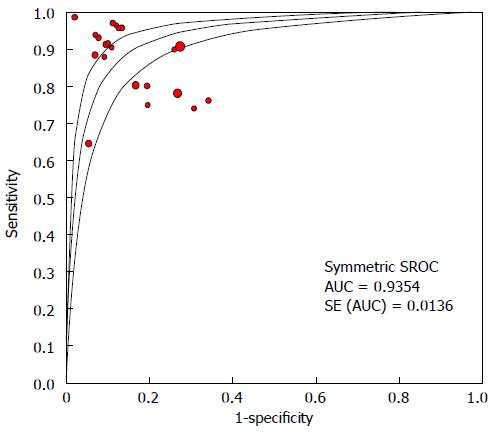
Figure 3 Summary receiver operating characteristic, with 95%CI.
SROC: Weighted symmetric summary receiver operating curve; AUC: Area under curve; SE: Standard error.
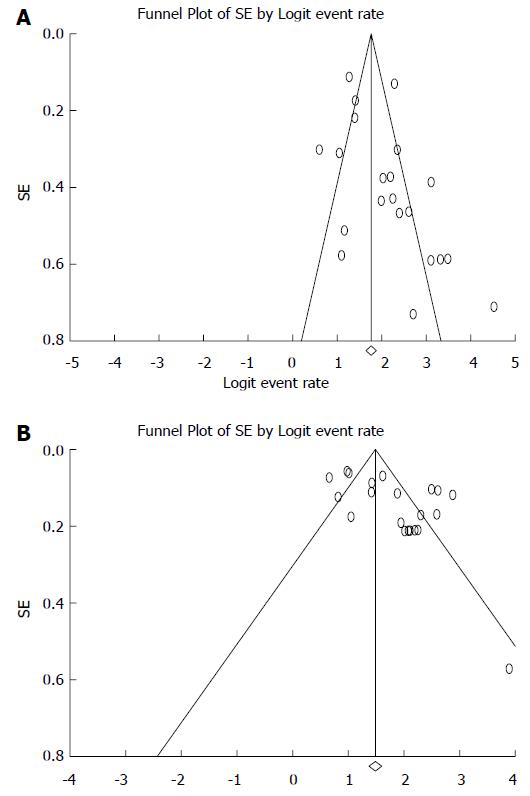
Figure 4 Funnel plot of standard error by logit event rate for sensitivity (A) and specificity (B).
Both funnel plots were asymmetric, indicating potential publication bias. SE: Standard error.
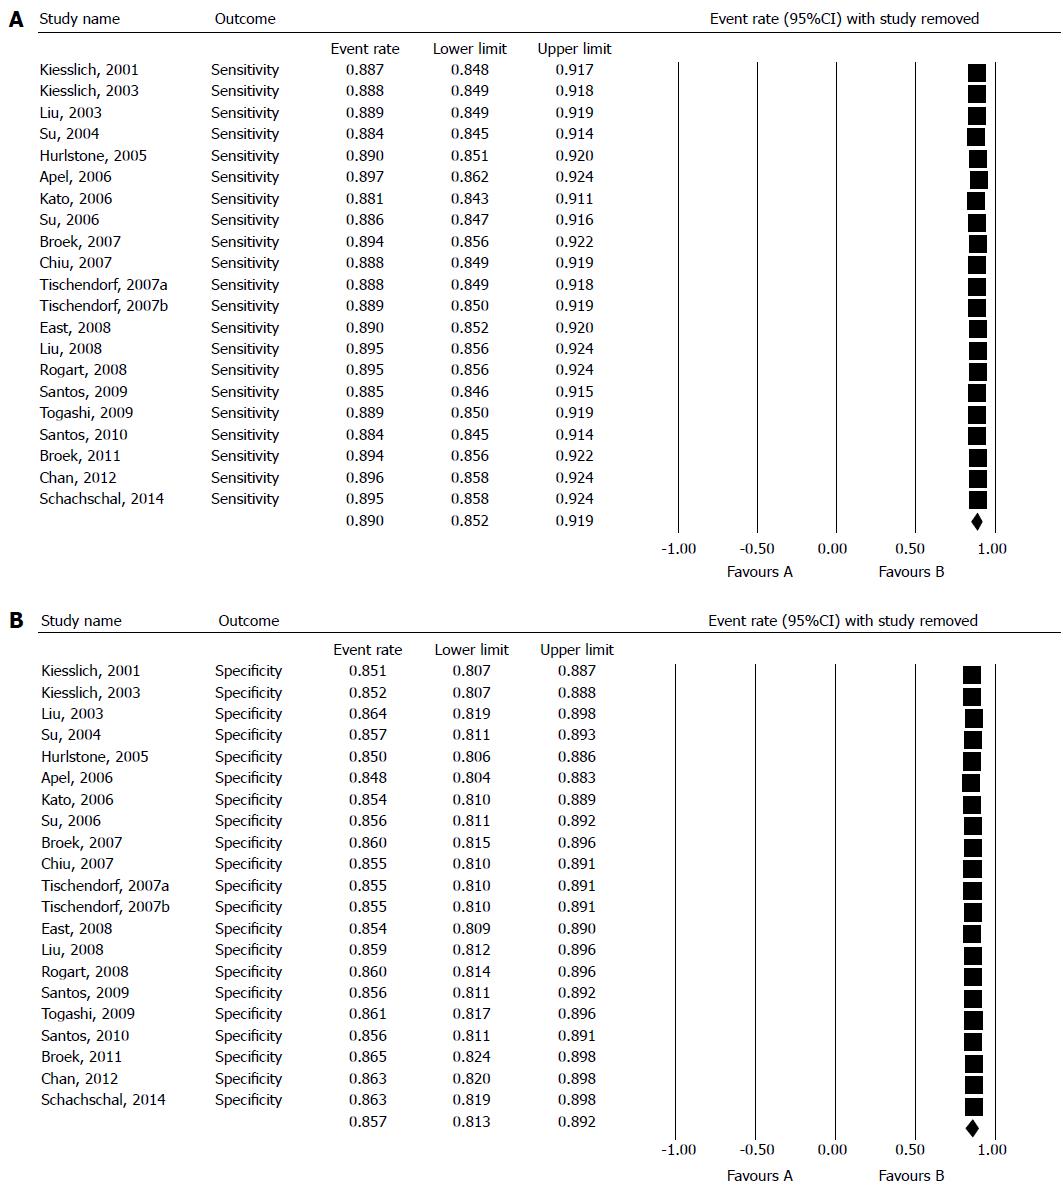
Figure 5 Forest plot omitting one study each time to determine sensitivity (A) and specificity (B).
The pooled result was not significantly affected by any of the individual studies, suggesting that the pooled results were stable.
- Citation: Li M, Ali SM, Umm-a-OmarahGilani S, Liu J, Li YQ, Zuo XL. Kudo’s pit pattern classification for colorectal neoplasms: A meta-analysis. World J Gastroenterol 2014; 20(35): 12649-12656
- URL: https://www.wjgnet.com/1007-9327/full/v20/i35/12649.htm
- DOI: https://dx.doi.org/10.3748/wjg.v20.i35.12649


