Copyright
©2014 Baishideng Publishing Group Inc.
World J Gastroenterol. Sep 21, 2014; 20(35): 12551-12558
Published online Sep 21, 2014. doi: 10.3748/wjg.v20.i35.12551
Published online Sep 21, 2014. doi: 10.3748/wjg.v20.i35.12551
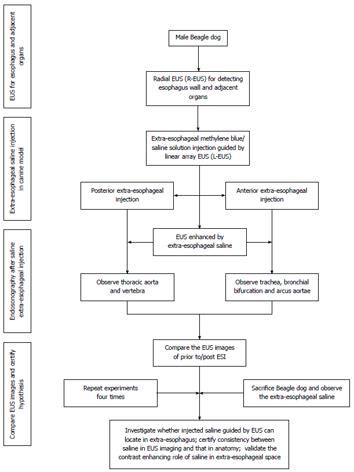
Figure 1 Flow diagram for the study.
ESI was performed in Beagle dogs, detected by EUS, and confirmed by subsequent exploratory thoracotomy. EUS: Endoscopic ultrasound; ESI: Extraesophageal saline injection; R-EUS: Radial EUS; L-EUS: Linear-array EUS.
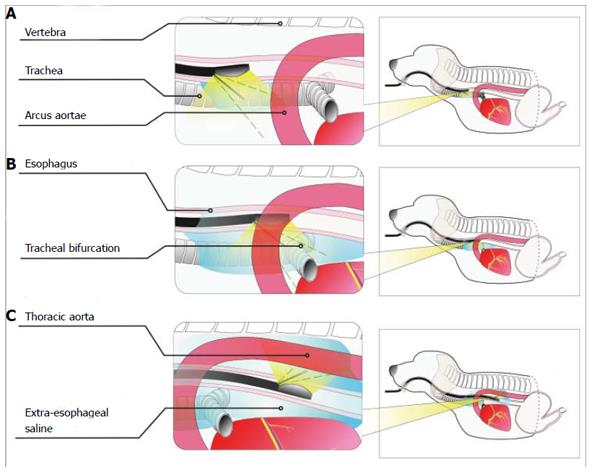
Figure 2 Schematic diagram of extraesophageal puncture in different sections.
A: Positioning of the puncture point in the upper thoracic segment. The puncture point was located in the anterior esophageal wall to distinguish between the trachea and the esophagus and between the left upper large thoracic vessels and the esophagus; B: Positioning of the puncture point in the middle thoracic segment. The puncture point was located in the anterior esophageal wall to distinguish between the bronchial bifurcation and the esophagus and between the arcus aortae and the esophagus; C: Positioning of the puncture point in the lower thoracic segment. The puncture point was located in the posterior esophageal wall to distinguish between the thoracic aorta and the esophagus.
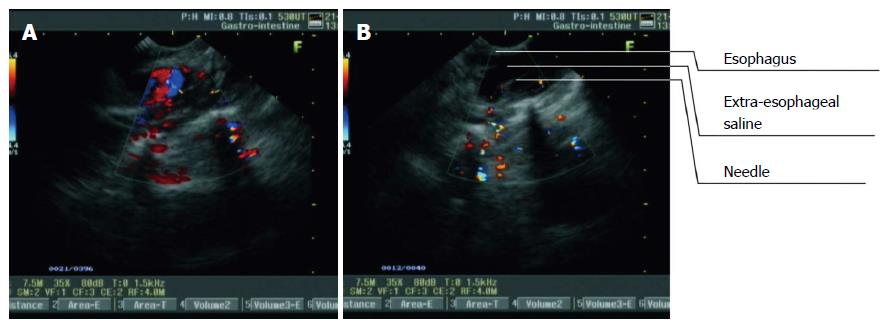
Figure 3 Procedure of extraesophageal saline injection guided by real-time linear-array endoscopic ultrasonography in the lower thoracic segment of the esophagus.
A: The thoracic aorta was visualized as turbulent blood flow on a color Doppler flow imaging (CDFI) image from L-EUS; B: The puncture probe was rotated until the thoracic aorta disappeared. Extraesophageal puncture, reverse suction, and saline injection were then performed consecutively. With an increase in the volume of injected saline, the hypoechoic area outside the esophagus expanded.
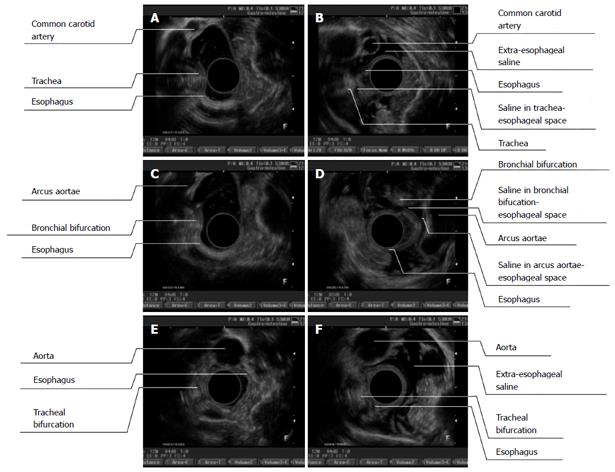
Figure 4 Endoscopic ultrasonography images (before and after endoscopic ultrasound) of different segments of the esophagus (A/B, upper thoracic segment; C/D, middle thoracic segment; E/F, lower thoracic segment).
A: Before extraesophageal saline injection (ESI), it was difficult to observe the esophageal adventitia and common carotid artery. The esophagus and trachea were observed to be close to each other, it was difficult to distinguish their boundaries, and the tracheal trace was distinct; B: After ESI, the space between the esophagus and the aorta along the left anterior wall was enlarged and displayed as a hypoechoic area. The esophageal adventitia and aortic adventitia were clearly distinguishable. A thread-like hypoechoic area was visualized between the esophageal-tracheal spaces, which created a clear boundary between them; C: Before ESI, it was difficult to distinguish between the adventitias of the esophagus and the arcus aortae; D: After ESI, the space between the esophagus and the arcus aortae was enlarged and filled with a hypoechoic area. The esophageal adventitia and aortic adventitia were clearly distinguishable; E: Before ESI, it was difficult to distinguish between the esophageal adventitia and the thoracic aorta; F: After ESI, the space between the esophagus and the thoracic aorta was enlarged and full of hypoechoic areas, and the adventitious of both the esophagus and the thoracic aorta were distinguishable.
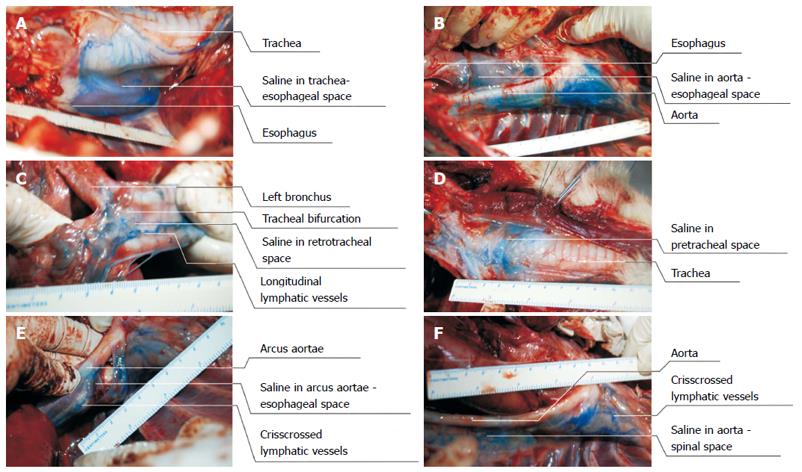
Figure 5 Findings of exploratory thoracotomy.
A: Saline containing methylene blue dye deposited in the space between the trachea and the esophagus; B: Saline containing methylene blue dye deposited in the esophageal-aortic space and posterior thoracic aortic tissue; C: Saline containing methylene blue dye deposited in the posterior bronchial tissue (the space between the esophagus and the bronchial bifurcation). Thick and longitudinal lymphatic vessels dyed with methylene blue were also easily visualized; D: Saline containing methylene blue dye deposited in the pretracheal space.
- Citation: Li JJ, Shan HB, He LJ, Wang TD, Xiong H, Chen LM, Li XH, Huang XX, Luo GY, Li Y, Xu GL. Extraesophageal saline enhances endoscopic ultrasonography to differentiate esophagus and adjacent organs. World J Gastroenterol 2014; 20(35): 12551-12558
- URL: https://www.wjgnet.com/1007-9327/full/v20/i35/12551.htm
- DOI: https://dx.doi.org/10.3748/wjg.v20.i35.12551


