Copyright
©2014 Baishideng Publishing Group Inc.
World J Gastroenterol. Sep 7, 2014; 20(33): 11850-11855
Published online Sep 7, 2014. doi: 10.3748/wjg.v20.i33.11850
Published online Sep 7, 2014. doi: 10.3748/wjg.v20.i33.11850
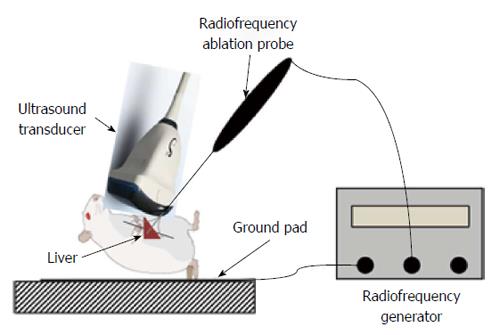
Figure 1 Experimental setup employed in this study.
Radiofrequency ablation of the liver was performed in 10 rats under laparotomy.
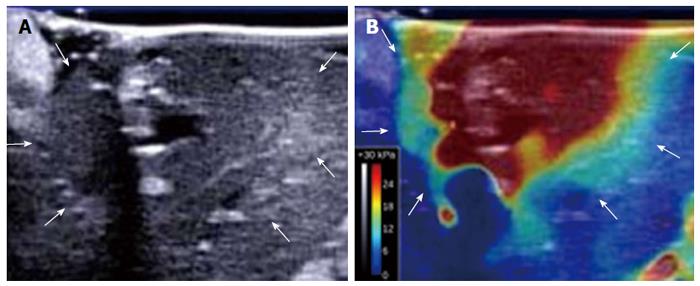
Figure 2 B-mode ultrasound image and shear-wave elastography image of a thermal lesion.
A: B-mode ultrasound image of the liver obtained 15 min after ablation shows a poorly defined hypoechoic lesion with a hyperechoic rim (arrows); B: Corresponding shear-wave elastography image of the liver clearly delineates the ablated area (arrows).
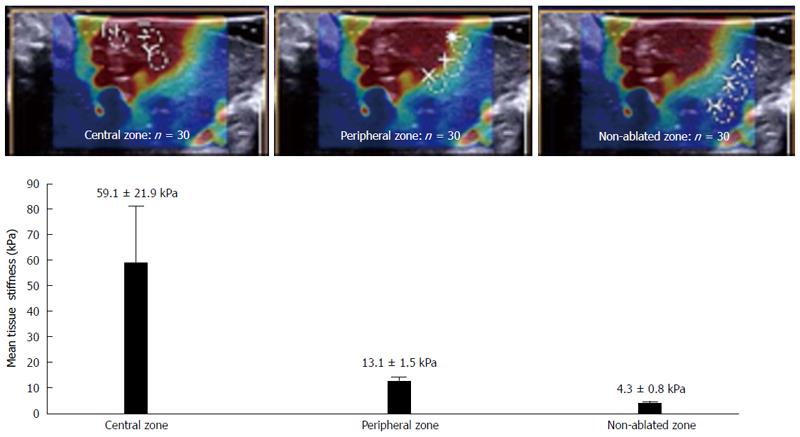
Figure 3 Liver tissue stiffness values of the thermal lesions.
Mean tissue stiffness of the central zone, peripheral zone, and non-ablated zone of the livers after radiofrequency ablation. The images at the top show examples of how the regions of interest in each zone were selected.
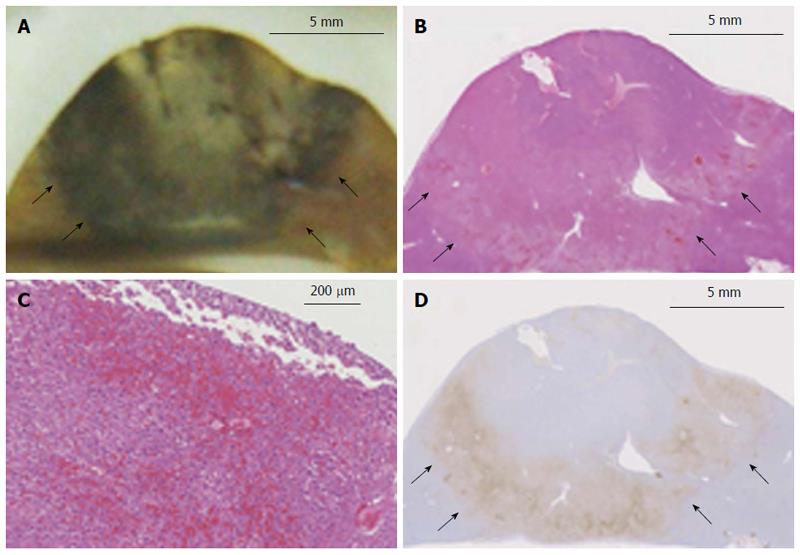
Figure 4 Histopathological findings of a thermal lesion.
A: Gross pathological examination of a radiofrequency (RF)-ablated liver shows a core area of white coagulation and a surrounding dark rim of hemorrhagic tissue (arrows). Scale bar: 5 mm; B, C: H-E staining of an RF-ablated liver shows a hemorrhagic rim surrounding the ablated area (arrows), with sinusoidal dilatation and congestion associated with cellular dissociation. Scale bar in (B): 5 mm, and in (C): 200 μm; D: Hsp70 staining of the hemorrhagic rim in (B) shows a clearly demarcated band of Hsp70 expression (arrows), which is suggestive of the presence of thermally damaged cells within the rim. Scale bar: 5 mm.
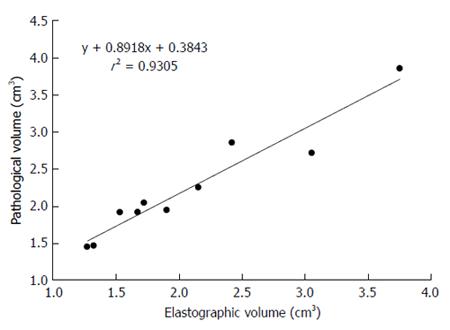
Figure 5 Correlation between shear-wave elastography and gross pathological findings.
The correlation between the volume of liver ablation depicted by 3D shear-wave elastography and that estimated by gross pathological examination was 0.9305, which is highly significant.
- Citation: Sugimoto K, Oshiro H, Ogawa S, Honjo M, Hara T, Moriyasu F. Radiologic-pathologic correlation of three-dimensional shear-wave elastographic findings in assessing the liver ablation volume after radiofrequency ablation. World J Gastroenterol 2014; 20(33): 11850-11855
- URL: https://www.wjgnet.com/1007-9327/full/v20/i33/11850.htm
- DOI: https://dx.doi.org/10.3748/wjg.v20.i33.11850


