Copyright
©2014 Baishideng Publishing Group Inc.
World J Gastroenterol. Aug 14, 2014; 20(30): 10495-10503
Published online Aug 14, 2014. doi: 10.3748/wjg.v20.i30.10495
Published online Aug 14, 2014. doi: 10.3748/wjg.v20.i30.10495
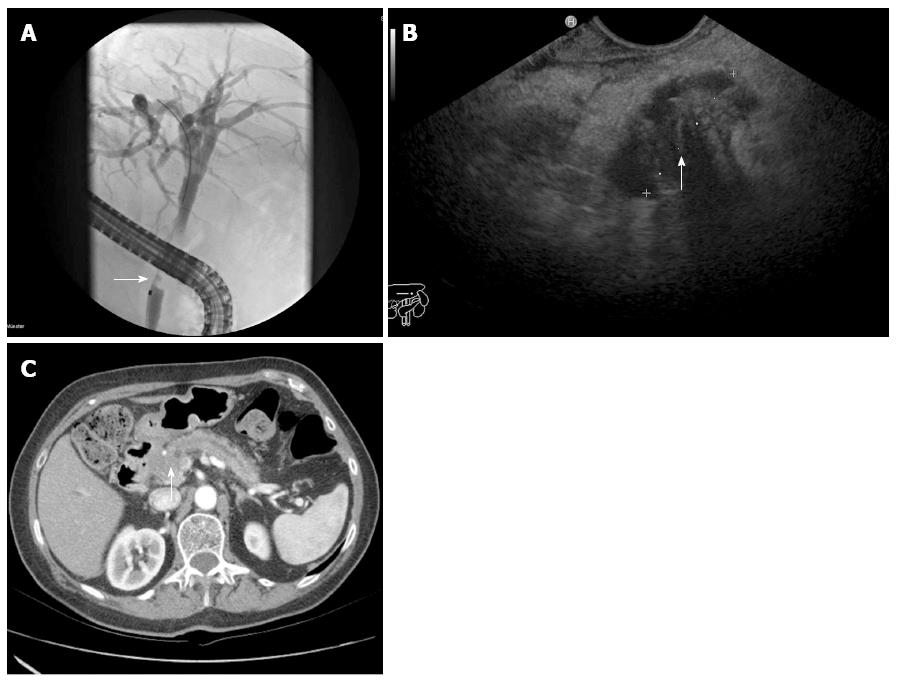
Figure 1 Imaging of pancreatic cancer with a malignant bile duct stricture.
A: Fluoroscopic picture showing the bile duct stricture as filling defects by endoscopic retrograde cholangio-pancreatography (indicated by an arrow); B: Endosonography showing a pancreatic mass (indicated by an arrow); C: Computed tomography showing the tumor of the pancreatic head (indicated by an arrow) with an enlarged pancreatic duct.
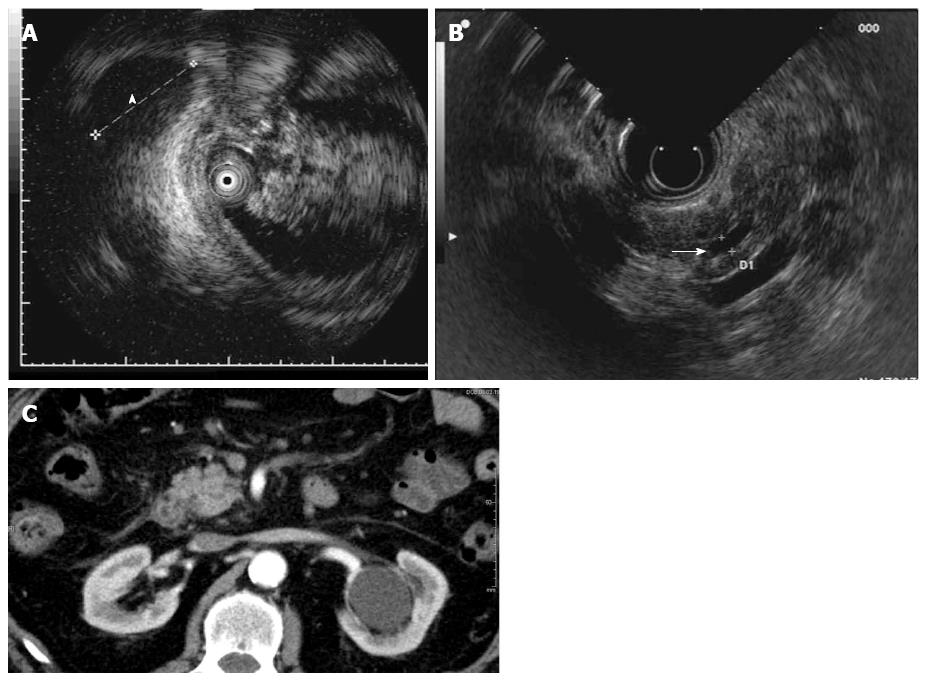
Figure 2 Imaging of pancreatic cancer with a malignant bile duct stricture.
A: Intraductal ultrasound showing a hypoechoic pancreatic mass of 36 mm in diameter (indicated by an arrowhead); B: Endosonographic picture showing a dilated pancreatic duct of 4 mm in diameter, but no visible pancreatic mass (arrow); C: Computed tomography without a visible tumor in the pancreatic head.
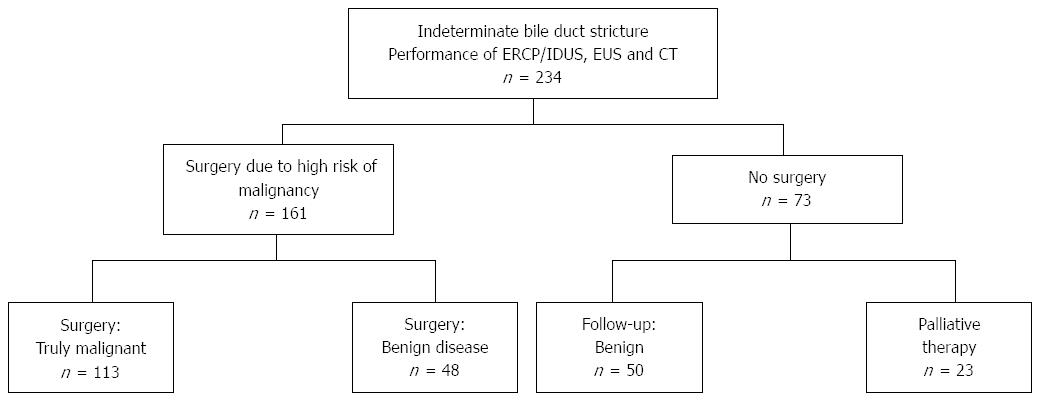
Figure 3 Flow chart showing the enrollment of study patients.
ERCP: Endoscopic retrograde cholangio-pancreatography; IDUS: Intraductal ultrasound; EUS: Endosonography; CT: Computed tomography.
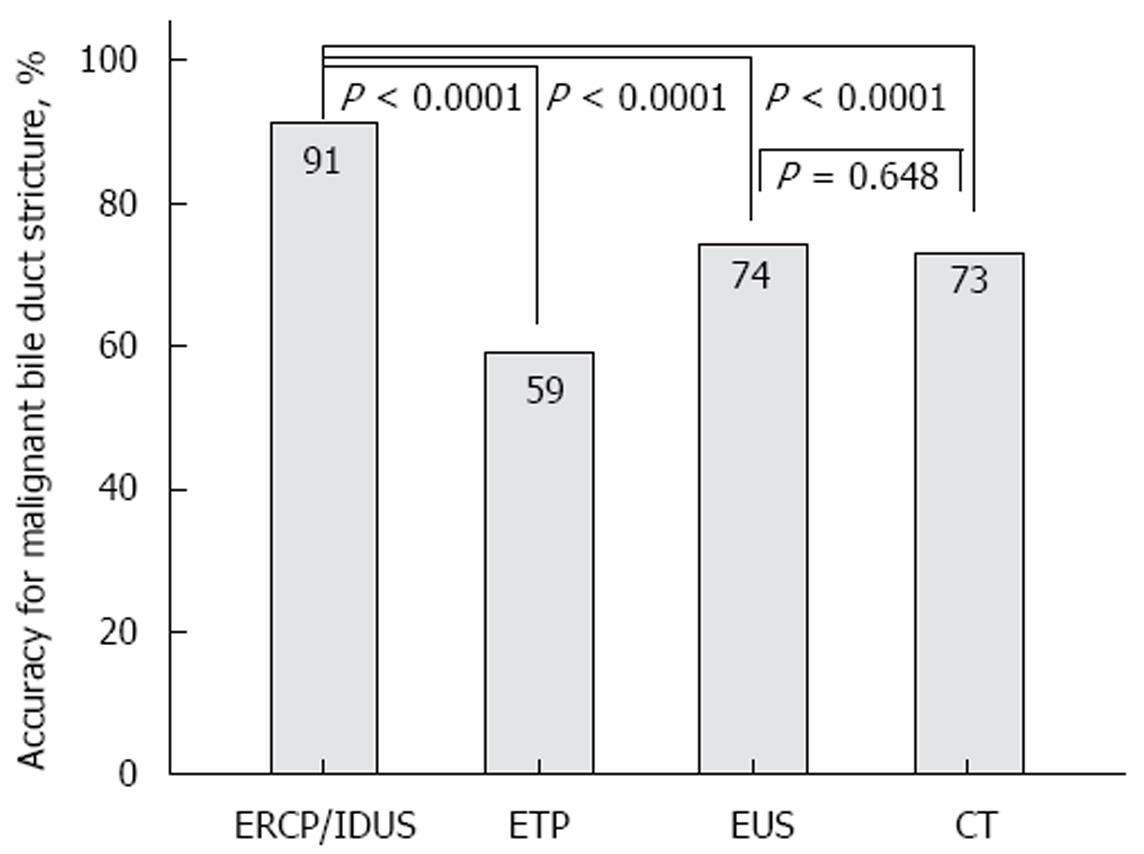
Figure 4 Test for statistical significance (McNemar’s test) in terms of the diagnostic accuracy in identifying a malignant bile duct stricture (presented as a diagram).
ERCP: Endoscopic retrograde cholangio-pancreatography; IDUS: Intraductal ultrasound; EUS: Endosonography; ETP: Endoscopic transpapillary forceps biopsies; CT: Computed tomography.
- Citation: Heinzow HS, Kammerer S, Rammes C, Wessling J, Domagk D, Meister T. Comparative analysis of ERCP, IDUS, EUS and CT in predicting malignant bile duct strictures. World J Gastroenterol 2014; 20(30): 10495-10503
- URL: https://www.wjgnet.com/1007-9327/full/v20/i30/10495.htm
- DOI: https://dx.doi.org/10.3748/wjg.v20.i30.10495


