Copyright
©2014 Baishideng Publishing Group Inc.
World J Gastroenterol. Aug 14, 2014; 20(30): 10395-10404
Published online Aug 14, 2014. doi: 10.3748/wjg.v20.i30.10395
Published online Aug 14, 2014. doi: 10.3748/wjg.v20.i30.10395
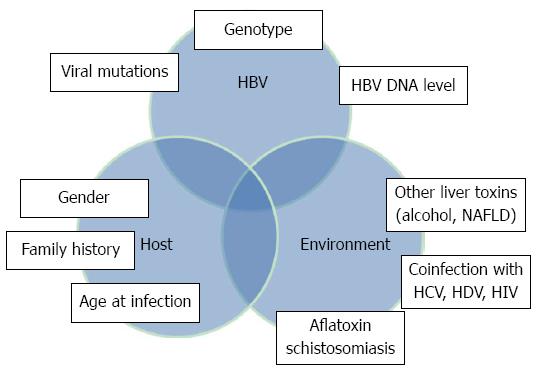
Figure 1 Factors interacting to affect the natural history of chronic hepatitis B.
HBV: Hepatitis B virus; HIV: Human immunodeficiency virus; HDV: Hepatitis D virus; HCV: Hepatitis C virus; NAFLD: Non-alcoholic fatty liver disease.
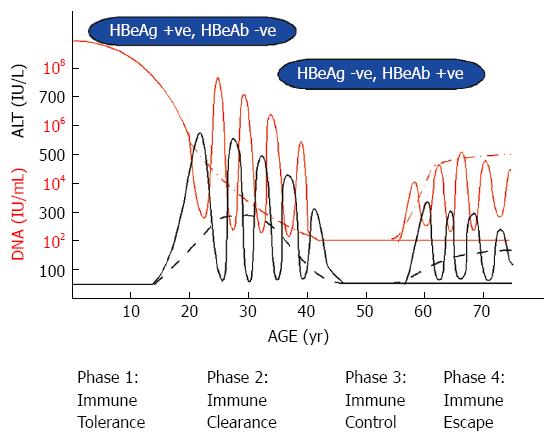
Figure 2 Natural history and phases of chronic hepatitis B.
The figure represents the possible courses of perinatally acquired chronic hepatitis B and progression through different phases. The red line represents hepatitis B virus DNA with fluctuations in viral load during flares while dashed red represents an alternative course. The black line represents alanine aminotransferase (ALT) with the dashed black line representing persistent elevation of ALT while the solid line represents intermittent elevation of ALT and flares. HBeAg: Hepatitis B e antigen; HBeAb: Antibodies to HBeAg.
- Citation: Croagh CM, Lubel JS. Natural history of chronic hepatitis B: Phases in a complex relationship. World J Gastroenterol 2014; 20(30): 10395-10404
- URL: https://www.wjgnet.com/1007-9327/full/v20/i30/10395.htm
- DOI: https://dx.doi.org/10.3748/wjg.v20.i30.10395


