Copyright
©2014 Baishideng Publishing Group Inc.
World J Gastroenterol. Jul 28, 2014; 20(28): 9534-9540
Published online Jul 28, 2014. doi: 10.3748/wjg.v20.i28.9534
Published online Jul 28, 2014. doi: 10.3748/wjg.v20.i28.9534
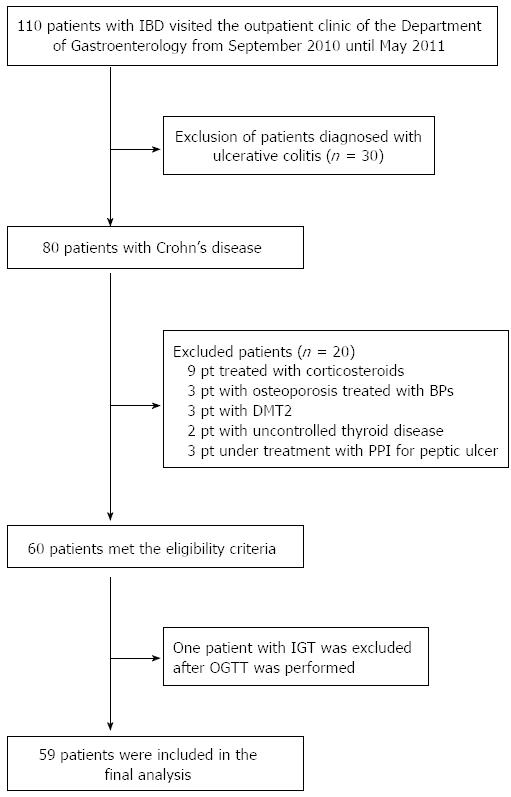
Figure 1 Flow chart of enrolled patients.
IBD: Inflammatory bowel disease; pt: Patients; BPs: Bisphosphonates; DMT2: Diabetes mellitus type 2; PPI: Proton pump inhibitors; OGTT: Oral glucose tolerance test; IGT: Impaired glucose tolerance.
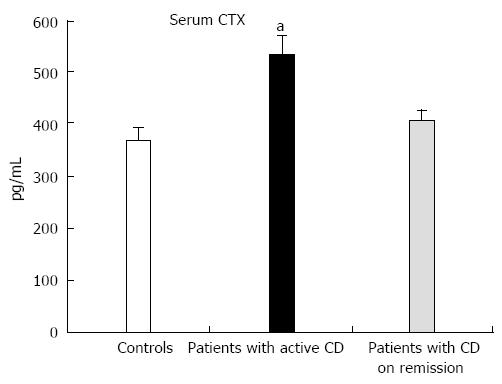
Figure 2 Baseline levels of serum C-terminal crosslinking telopeptide of type I collagen in controls and in patients with Crohn’s disease active or in remission.
CTX: C-terminal crosslinking telopeptide of type I collagen; CD: Crohn’s disease. aP < 0.05 vs control group.
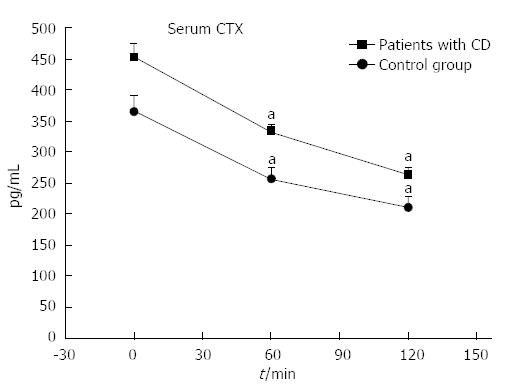
Figure 3 The effect of oral glucose load in serum C-terminal crosslinking telopeptide of type I collagen levels in patients with Crohn’s disease and in the control group.
CTX: C-terminal crosslinking telopeptide of type I collagen; CD: Crohn’s disease. aP < 0.05 vs baseline values.
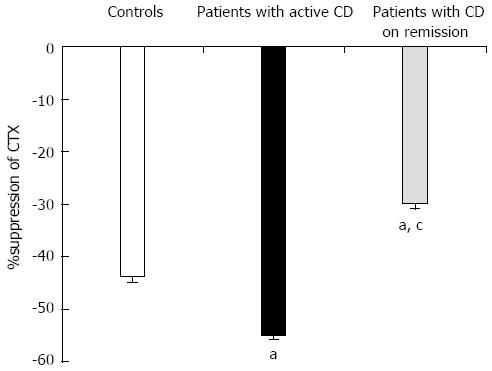
Figure 4 %suppression of serum C-terminal crosslinking telopeptide of type I collagen levels at 2 h after oral glucose load in controls and in patients with Crohn’s disease active or in remission.
aP < 0.05 vs control group; cP < 0.05 vs patients with active Crohn’s disease (CD). CTX: C-terminal crosslinking telopeptide of type I collagen.
- Citation: Karatzoglou I, Yavropoulou MP, Pikilidou M, Germanidis G, Akriviadis E, Papazisi A, Daniilidis M, Zebekakis P, Yovos JG. Postprandial response of bone turnover markers in patients with Crohn’s disease. World J Gastroenterol 2014; 20(28): 9534-9540
- URL: https://www.wjgnet.com/1007-9327/full/v20/i28/9534.htm
- DOI: https://dx.doi.org/10.3748/wjg.v20.i28.9534


