Copyright
©2014 Baishideng Publishing Group Inc.
World J Gastroenterol. Jul 21, 2014; 20(27): 9191-9199
Published online Jul 21, 2014. doi: 10.3748/wjg.v20.i27.9191
Published online Jul 21, 2014. doi: 10.3748/wjg.v20.i27.9191
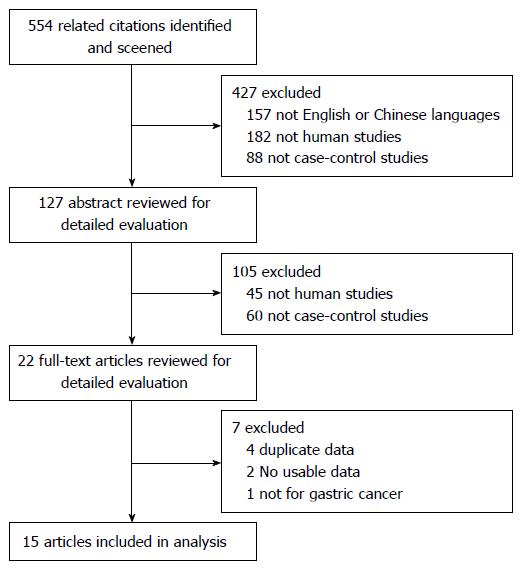
Figure 1 Flow diagram of study identification, inclusion, and exclusion.
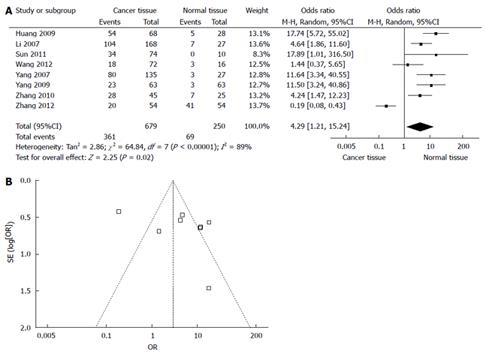
Figure 2 Forest plot for the association between Notch1 and gastric cancer (A) and funnel plot for all studies included in this meta-analysis of Notch1 and gastric cancer (B).
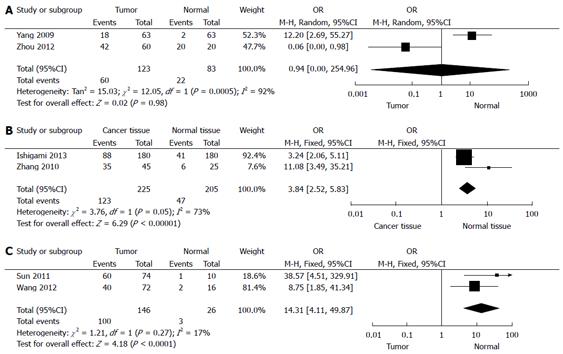
Figure 3 Forest plot.
A: For the association between Jagged1 and gastric cancer; B: For the association between Delta-like 4 and gastric cancer; C: For the association between Hes1 and gastric cancer.
- Citation: Du X, Cheng Z, Wang YH, Guo ZH, Zhang SQ, Hu JK, Zhou ZG. Role of Notch signaling pathway in gastric cancer: A meta-analysis of the literature. World J Gastroenterol 2014; 20(27): 9191-9199
- URL: https://www.wjgnet.com/1007-9327/full/v20/i27/9191.htm
- DOI: https://dx.doi.org/10.3748/wjg.v20.i27.9191


