Copyright
©2014 Baishideng Publishing Group Inc.
World J Gastroenterol. Jul 7, 2014; 20(25): 8092-8101
Published online Jul 7, 2014. doi: 10.3748/wjg.v20.i25.8092
Published online Jul 7, 2014. doi: 10.3748/wjg.v20.i25.8092
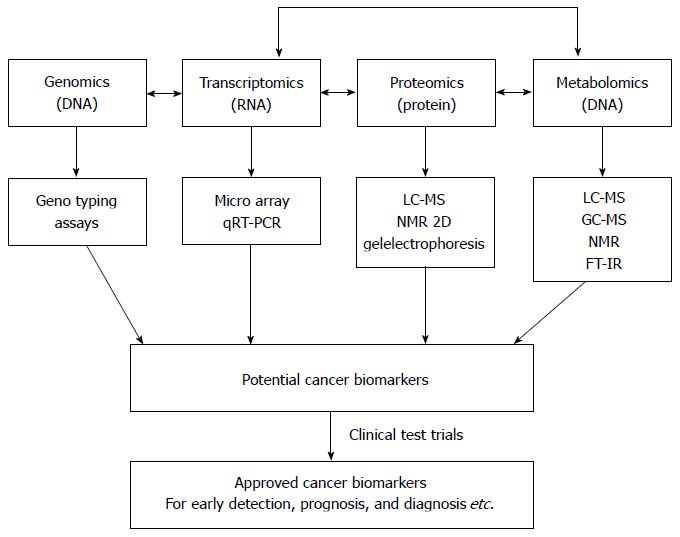
Figure 1 Biological organization of different omic technologies[20].
The position of metabolomics is shown with respect to the other “omic” methods. In addition, a scheme for the discovery of cancer biomarkers using “omics” -based approaches is shown. qRT-PCR: Quantitative reverse transcriptase-polymerase chain reaction; LC-MS: Liquid chromatography-mass spectrometry; GC-MS: Gas chromatography-mass spectrometry; NMR: Nuclear magnetic resonance; FT-IR: Fourier-transform infrared.
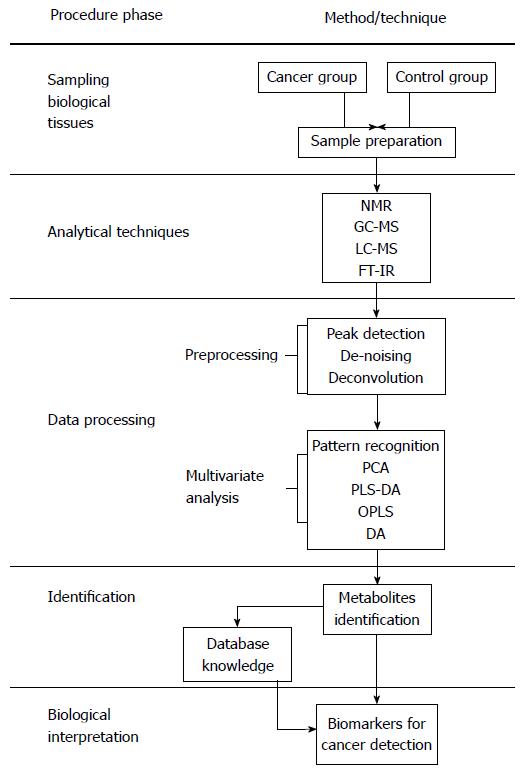
Figure 2 Metabolic procedures for cancer research[12,40-42].
LC-MS: Liquid chromatography-mass spectrometry; GC-MS: Gas chromatography-mass spectrometry; NMR: Nuclear magnetic resonance; FT-IR: Fourier-transform infrared; PCA: Principal component analysis; OPLS-DA: Orthogonal partial least squares discriminant analysis; PLS-DA: Partial least squares discriminant analysis.
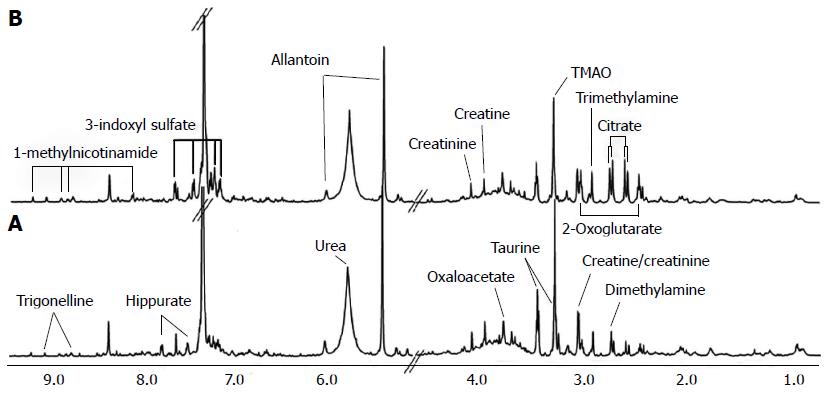
Figure 3 Nuclear magnetic resonance spectra of urine samples from control (A) and cancerous mice (B)[96].
A number of metabolites showed significant metabolic changes in their levels. For example, trimethylamine oxide (TMAO) levels are reduced in cancerous mice compared with control.
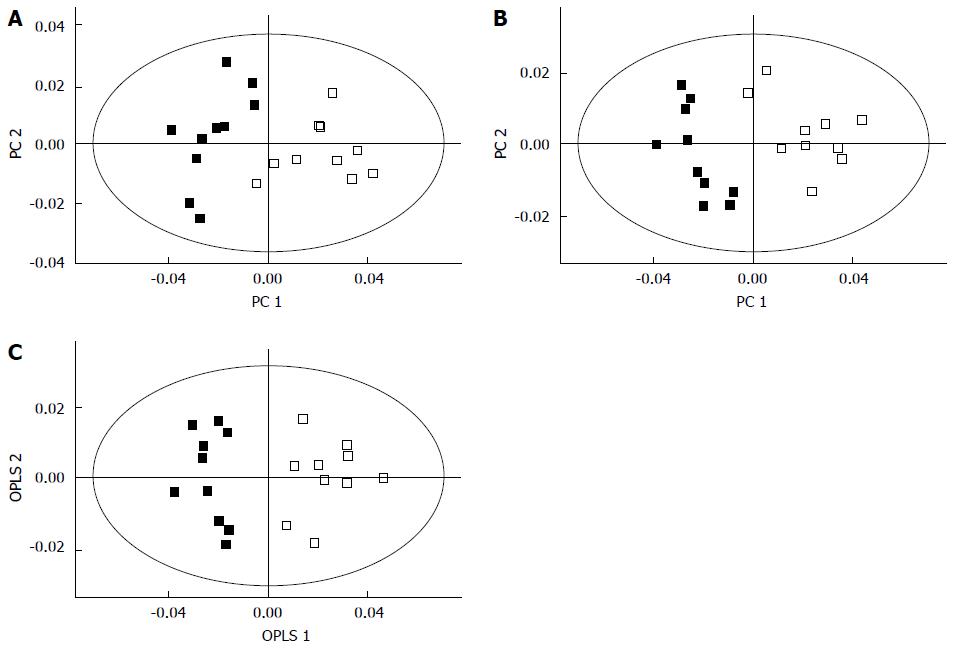
Figure 4 Separation of the cancer (filled squares) and control groups (empty squares) using principal component analysis (A), partial least squares- discriminant analysis (B), and orthogonal partial least squares discriminant analysis (C) in global profiling of urine samples in two-dimensional score plots[96].
These methods revealed that certain metabolites are involved in the separation of the two groups. OPLS: Orthogonal partial least squares; PC: Principal component.
- Citation: Jayavelu ND, Bar NS. Metabolomic studies of human gastric cancer: Review. World J Gastroenterol 2014; 20(25): 8092-8101
- URL: https://www.wjgnet.com/1007-9327/full/v20/i25/8092.htm
- DOI: https://dx.doi.org/10.3748/wjg.v20.i25.8092


