Copyright
©2014 Baishideng Publishing Group Inc.
World J Gastroenterol. Jun 21, 2014; 20(23): 7442-7451
Published online Jun 21, 2014. doi: 10.3748/wjg.v20.i23.7442
Published online Jun 21, 2014. doi: 10.3748/wjg.v20.i23.7442
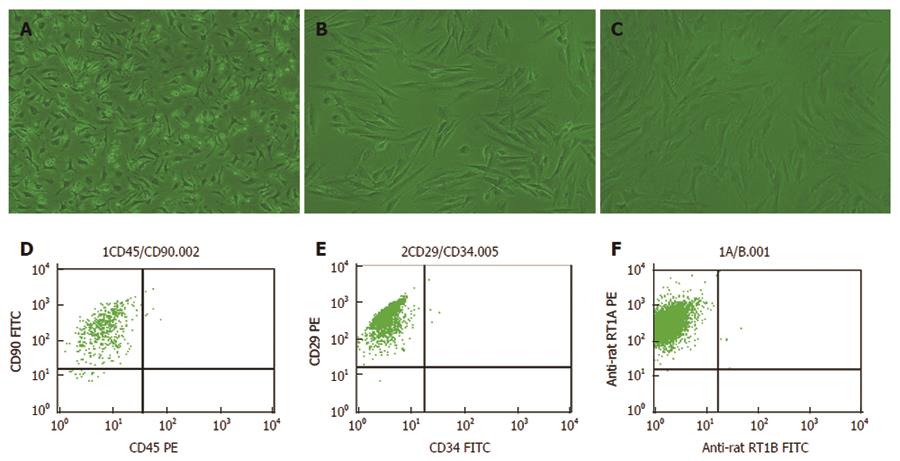
Figure 1 Morphology and flow cytometry results of Lewis-derived bone marrow mesenchymal stem cells.
A: First-passage bone marrow mesenchymal stem cells (BM MSCs); B: Second-passage BM MSCs; C: Third-passage BM MSCs (× 200 magnification); D: The proportion of CD90+ and CD450- cells was approximately 95.48%; E: The proportion of CD29+ and CD34- cells was approximately 99.82%; F: The proportion of RT1A+ and RT1B- cells was approximately 99.87%.
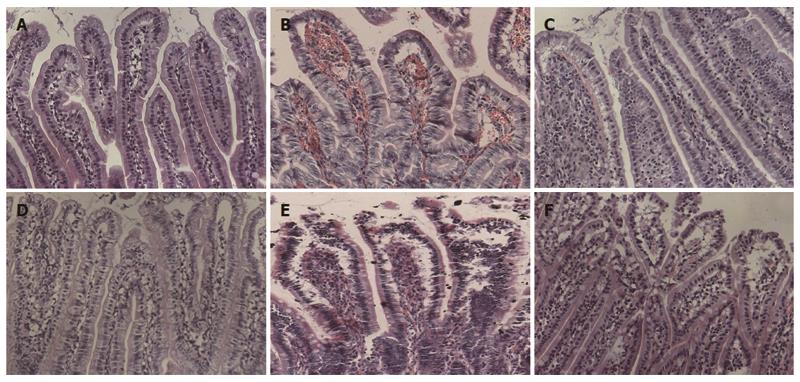
Figure 2 Graft histopathology at different time points after heterotopic intestinal transplantation (HE staining, × 200).
A: Normal intestine with normal villous architecture and glands in group A; B: Intestinal mucosa degradation and hemorrhage of the lamina propria, ulceration, decreased ratio of villus height and crypt height, aggravated lymphocyte infiltration, partial gland epithelial necrosis in group B at day 5 after operation; D: There were decreased intestinal mucosal villi with mild deformity and interstitial infiltration of inflammatory cells; E: The condition was aggravated 7 d after heterotopic intestinal transplantation, and there was epithelial degeneration, intestinal wall thinning and necrosis, and interstitial inflammatory cell infiltration in great quantities; C, F: Recovery of the damaged mucosa in group A at (C) day 5 and (F) day 7.
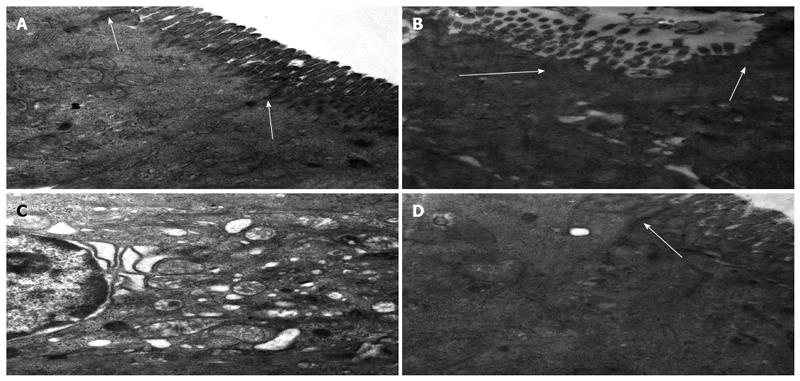
Figure 3 Ultrastructural characteristics of intestinal mucosa and tight junctions following heterotopic intestinal transplantation (magnification × 30000).
A: Epithelial cells and tight junctions (TJs) (arrows) were intact in group A; B: Intestinal microvilli and TJs (arrows) were disrupted, and some microvilli were loose; C: Organelles were swollen with reduced electron density at day 5 after transplantation in group B; D: Microvilli and mitochondria of the endothelial cells were almost normal and TJs (arrow) were not disrupted at day 5 after transplantation in group C.
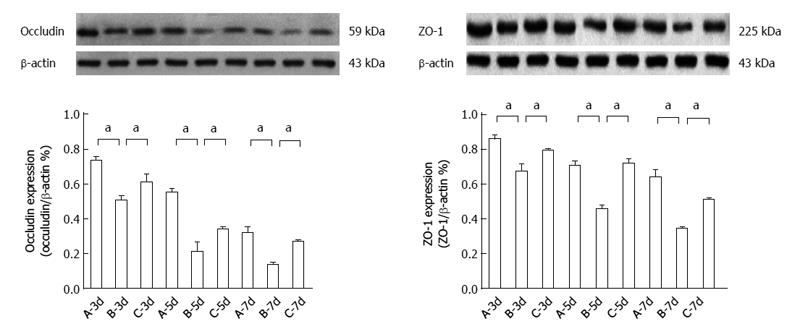
Figure 4 Occludin and zona occludens-1 protein expression after heterotopic intestinal transplantation.
Occludin and zona occludens (ZO)-1 protein expression was significantly lower in group B than in group A (aP < 0.05 vs group B at day 5: 0.2082 ± 0.0582 vs 0.5477 ± 0.0284; aP < 0.05 vs group B at day 7: 0.3415 ± 0.0128 vs 0.6387 ± 0.046). Occludin and ZO-1 protein expression was significantly higher in group C than in group B (aP < 0.05 vs group B at day 7: 0.2674 ± 0.0128 vs 0.1352 ± 0.0142; aP < 0.05 vs group B at day 5: 0.7189 ± 0.0289 vs 0.4556 ± 0.0242). A: Group A (non-rejection); B: Group B (rejection); C: Group C (bone marrow mesenchymal stem cells therapy). β-actin was used as the loading control. Values shown are the mean ± SD.
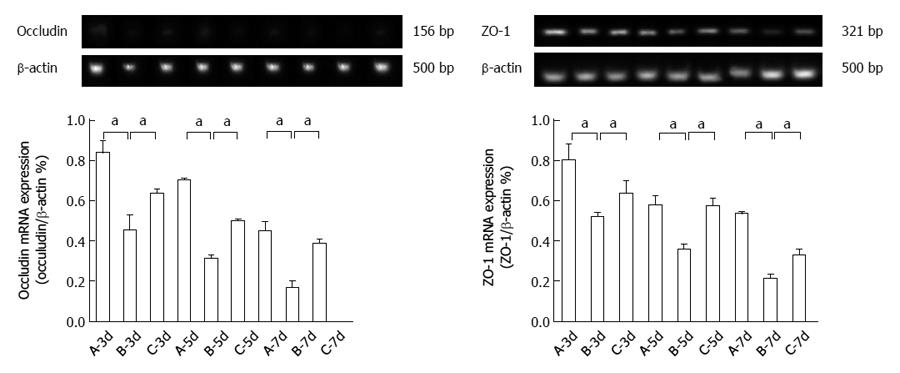
Figure 5 Occludin and zona occludens-1 mRNA expression after heterotopic intestinal transplantation.
Occludin and zona occludens (ZO)-1 mRNA expression was significantly lower in group B than in group A (aP < 0.05 vs group B at day 5: 0.3135 ± 0.0168 vs 0.7011 ± 0.0128; aP < 0.05 vs group B at day 7: 0.2101 ± 0.0279 vs 0.5345 ± 0.0136). Occludin and ZO-1 mRNA expression was significantly higher in group C than in group B at day 5 (aP < 0.05 vs group B at day 7: 0.3860 ± 0.0254 vs 0.1673 ± 0.0369; aP < 0.05 vs group B at day 5: 0.5727 ± 0.0419 vs 0.3598 ± 0.0242). A: Group A (non-rejection); B: Group B (rejection); C: Group C (bone marrow mesenchymal stem cells therapy). β-actin was used as the loading control. Values shown are the mean ± SD.
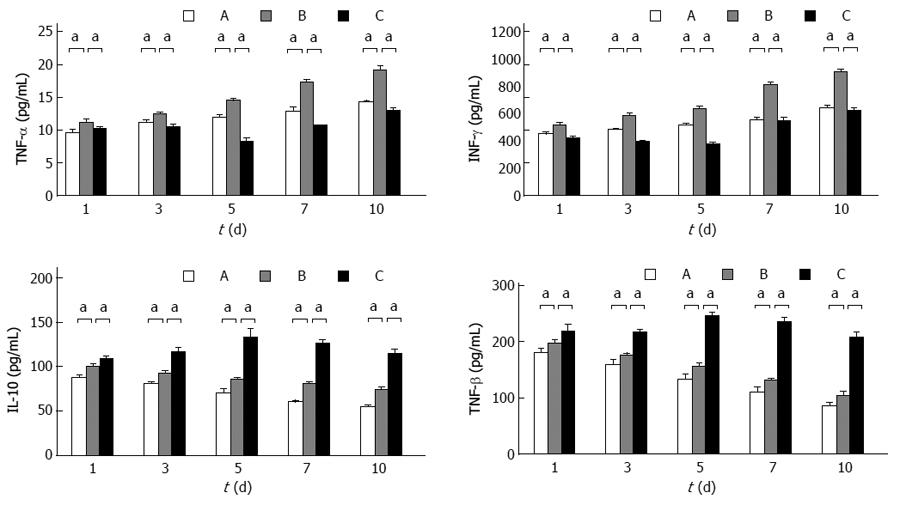
Figure 6 Graft tumor necrosis factor-α, interferon-γ, interleukin-10, and transforming growth factor-β levels.
Graft tumor necrosis factor-α (TNF-α), interferon-γ (INF-γ), interleukin-10 (IL-10), and transforming growth factor-β (TGF-β) levels in group B were significantly decreased compared to that in group A at day 7 (17.2128 ± 0.4991 vs 12.8364 ± 0.7131, P < 0.05; 810.2637 ± 25.1175 vs 555.3763 ± 17.9702, P < 0.05; 80.3756 ± 2.5866 vs 59.9878 ± 2.1521, P < 0.05; 130.8756 ± 3.3428 vs 109.9878 ± 9.7968, P < 0.05). Graft TNF-α and IFN-γ levels in group C were significantly decreased compared to that in group B at day 7 (10.6473 ± 0.0710 vs 17.2128 ± 0.4991, P < 0.05; 545.1506 ± 31.9416 vs 810.2637 ± 25.1175, P < 0.05); graft IL-10 and TGF-β levels in group C were significantly increased compared to that in group B at day 7 (125.7773 ± 4.7719 vs 80.3756 ± 2.5866, P < 0.05; 234.5273 ± 9.3980 vs 545.1506 ± 31.9416, P < 0.05). A: Group A (non-rejection); B: Group B (rejection); C: Group C (BM MSC therapy). All values are mean ± SD (n = 6). aP < 0.05 vs group B.
- Citation: Zhang W, Shen ZY, Song HL, Yang Y, Wu BJ, Fu NN, Liu T. Protective effect of bone marrow mesenchymal stem cells in intestinal barrier permeability after heterotopic intestinal transplantation. World J Gastroenterol 2014; 20(23): 7442-7451
- URL: https://www.wjgnet.com/1007-9327/full/v20/i23/7442.htm
- DOI: https://dx.doi.org/10.3748/wjg.v20.i23.7442


