Copyright
©2014 Baishideng Publishing Group Inc.
World J Gastroenterol. Jun 14, 2014; 20(22): 6974-6980
Published online Jun 14, 2014. doi: 10.3748/wjg.v20.i22.6974
Published online Jun 14, 2014. doi: 10.3748/wjg.v20.i22.6974
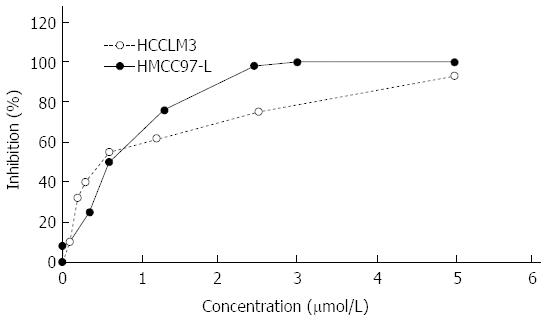
Figure 1 Adriamycin growth inhibition curve for MHCC97-L and HCCLM3 cells.
Adriamycin (ADM) (at concentrations of 0, 0.005, 0.1, 0.35, 0.6, 1.3, 2.45, 5 μmol/L) was added to MHCC97-L and HCCLM3 cells, and the cell death rate was calculated accordingly. The concentration and growth inhibition rates were taken as the X-axis and Y-axis, respectively. ADM LD50 for MHCC97-L cells was significantly lower than that for HCCLM3 cells (0.4123 ± 0.0236 μmol/L vs 0.5259 ± 0.0125 μmol/L, P < 0.05).
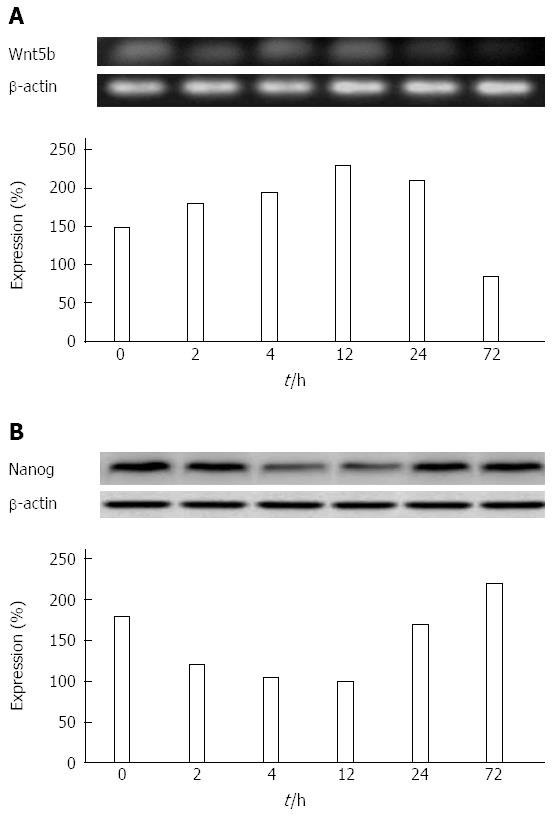
Figure 2 Wnt5b and Nanog expression in cell line MHCC97-L treated with Adriamycin.
A: Wnt5b expression in cell line MHCC97-L treated with Adriamycin (ADM). The expression of Wnt5b was evaluated at different time intervals (0 h, 2 h, 4 h, 12 h, 24 h, and 72 h) by western blot. The band gray value was highest at 12 h. The relative gene expression was indicated by the Wnt5b protein band gray value or β-actin band gray value calculated using western blot. The relative expression curve was a normal distribution line; B: Nanog expression in cell line MHCC97-L treated with ADM. The expression of Nanog was measured at different time intervals (0 h, 2 h, 4 h, 12 h, 24 h, and 72 h) by western blot. The band gray value was lowest at 12 h, and highest at 72 h. The relative expression of the gene was indicated by the Nanog protein band gray value or β-actin band gray value calculated using western blot. The relative expression curve was a parabola.
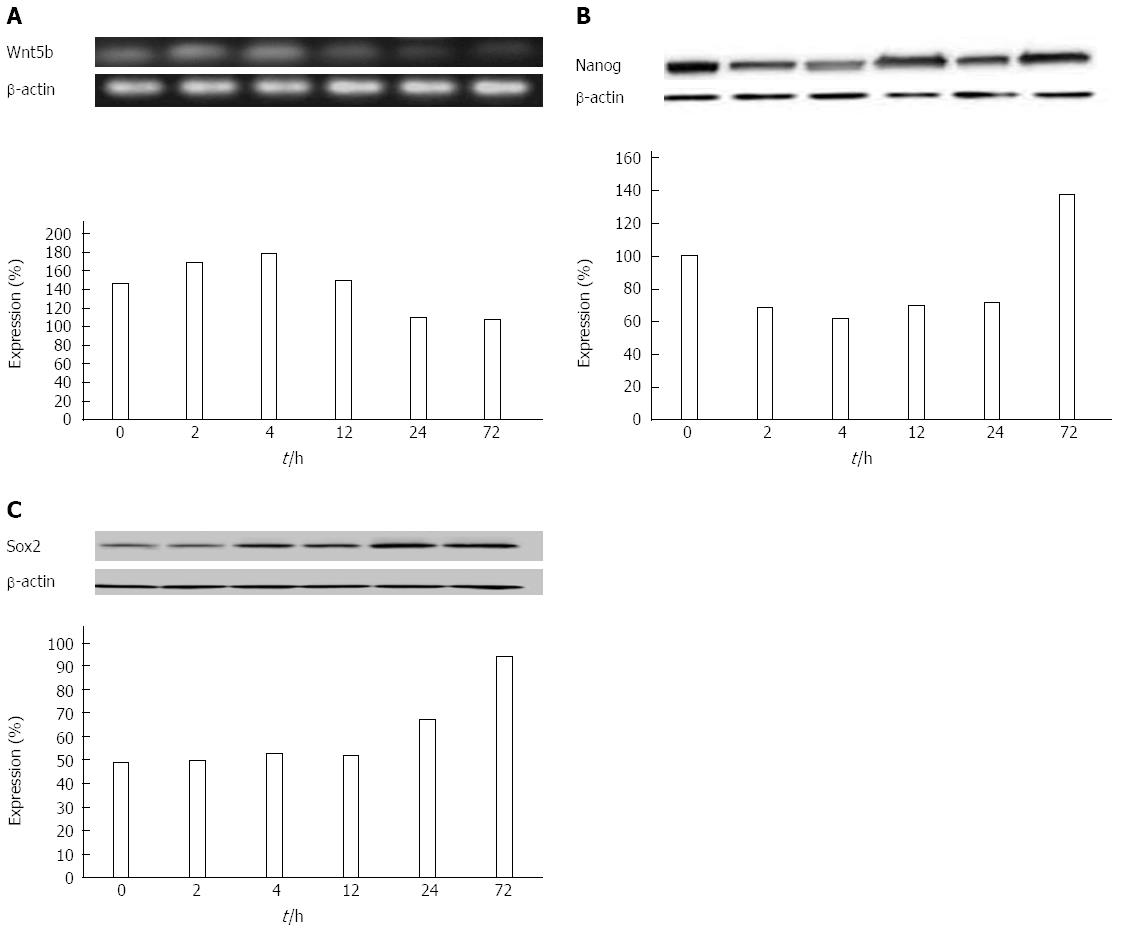
Figure 3 Wnt5b, Nanog and Sox2 expression in cell line HCCLM3 treated with Adriamycin.
A: Wnt5b expression in cell line HCCLM3 treated with Adriamycin (ADM). The expression of Wnt5b was evaluated at different time intervals (0 h, 2 h, 4 h, 12 h, 24 h, and 72 h) by western blot. The band gray value was highest at 4 h, and lower at both ends. The relative gene expression was indicated by the Wnt5b protein band gray value or β-actin band gray value calculated using western blot. The relative expression curve was a normal distribution line; B: Nanog expression in cell line HCCLM3 treated with ADM. The expression of Nanog was measured at different time intervals (0 h, 2 h, 4 h, 12 h, 24 h, and 72 h) by western blot. The band gray value was lowest at 4 h and highest at 72 h. The relative gene expression was indicated by the Nanog protein band gray value or β-actin band gray value calculated using western blot. The relative expression curve was a parabola, but was more concave than that in MHCC97-L cells; C: Sox2 expression in cell line HCCLM3 treated with ADM. The expression of Nanog was measured at different time intervals (0 h, 2 h, 4 h, 12 h, 24 h, and 72 h) by western blot. The band gray value increased with time and was highest at 72 h. The relative gene expression was indicated by the Nanog protein band gray value or β-actin band gray value calculated using western blot. The relative gene expression correlated positively with time.
- Citation: Sun D, Qin L, Xu Y, Liu JX, Tian LP, Qian HX. Influence of adriamycin on changes in Nanog, Oct-4, Sox2, ARID1 and Wnt5b expression in liver cancer stem cells. World J Gastroenterol 2014; 20(22): 6974-6980
- URL: https://www.wjgnet.com/1007-9327/full/v20/i22/6974.htm
- DOI: https://dx.doi.org/10.3748/wjg.v20.i22.6974


