Copyright
©2014 Baishideng Publishing Group Inc.
World J Gastroenterol. Jun 14, 2014; 20(22): 6869-6877
Published online Jun 14, 2014. doi: 10.3748/wjg.v20.i22.6869
Published online Jun 14, 2014. doi: 10.3748/wjg.v20.i22.6869
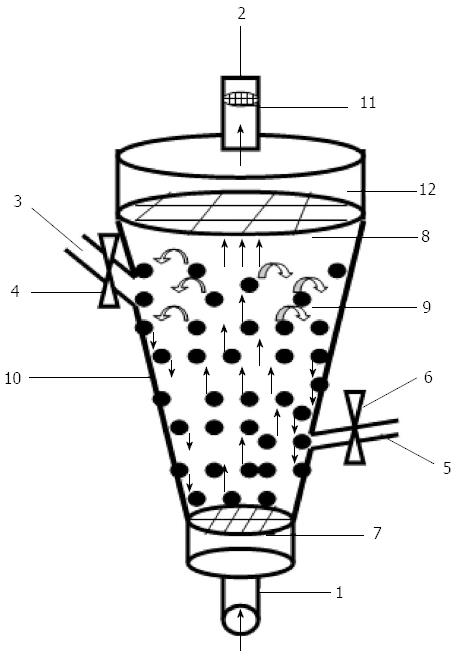
Figure 1 Different components of the choanoid fluidized bed bioreactor.
1: Blood inflow; 2: Blood outflow; 3: Microcapsules accessing port; 4: Upper valve; 6: Lower valve; 5: Blood sample port; 7 and 8: Cell sieve; 9: Microcapsulated hepatocytes; 10: Choanoid container; 11: Cellular filter; 12: Buffer zone.
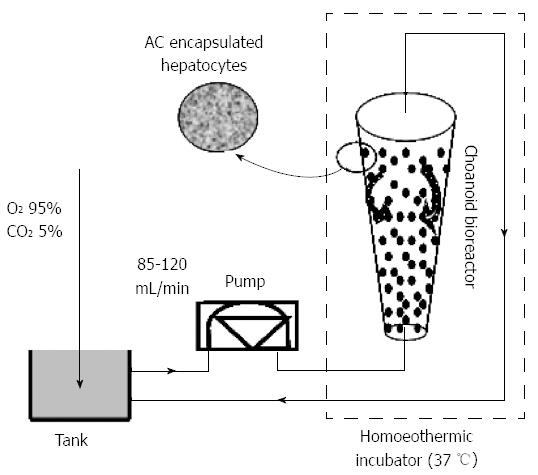
Figure 2 Fluidized bed bioreactor artificial liver.
General setup includes the bioreactor hosting alginate/chitosan (AC) beads in the continuous fluidized bed motion.
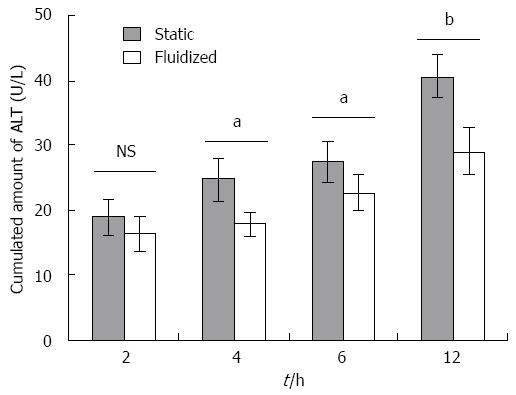
Figure 3 Changes in alanine aminotransferase in encapsulated hepatocytes in medium (n = 5).
Levels are given as U/L (mean ± SD), (gray bar) encapsulated in alginate/chitosan (AC) microcapsules in static conditions; (white bar) encapsulated in AC microcapsules and placed in the choanoid-fluidized bed bioreactor. Student’s t test (aP < 0.05; bP < 0.01, static vs fluidized). NS: Not significant; ALT: Alanine aminotransferase.
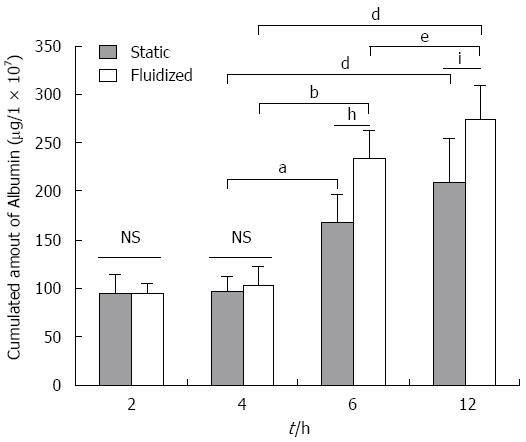
Figure 4 Secretion of albumin from encapsulated hepatocytes in medium (n = 5).
The levels are given as μg/L (mean ± SD), (gray bar) encapsulated in alginate/chitosan (AC) microcapsules in static conditions; (white bar) encapsulated in AC microcapsules and placed in the choanoid-fluidized bed bioreactor. Student’s t test (aP < 0.05, 4 h vs 6 h in Static; bP < 0.01, 4 h vs 6 h in Fluidized; dP < 0.01, 4 h vs 12 h in Static; eP < 0.05, 6 h vs 12 h in Fluidized; hP < 0.01, Static at 6 h vs Fluidized at 6 h; iP < 0.05, Static at 12 h vs Fluidized at 12 h). NS: Not significant.
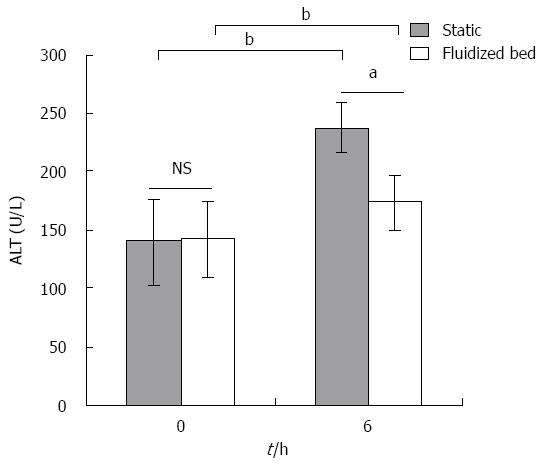
Figure 5 Changes in alanine aminotransferase in encapsulated hepatocytes in exchanged plasma (n = 5).
The levels are given as U/L (mean ± SD), (gray bar) encapsulated in alginate/chitosan (AC) microcapsules in static conditions; (white bar) encapsulated in AC microcapsules and placed in the choanoid-fluidized bed bioreactor. Student’s t test (aP < 0.05, Static vs Fluidized bed; bP < 0.01, 0 h vs 6 h). NS: Not significant; ALT: Alanine aminotransferase.
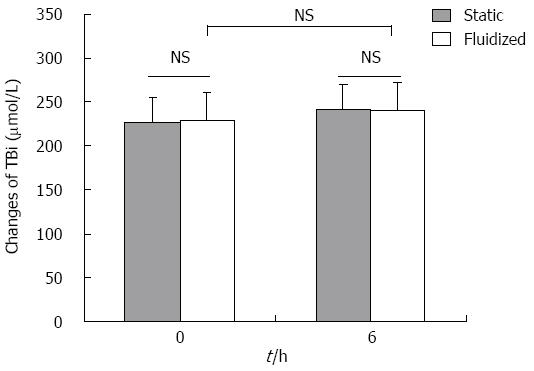
Figure 6 Changes in total bilirubin in encapsulated hepatocytes in exchanged plasma (n = 5).
The levels are given as μmol/L (mean ± SD), (gray bar) encapsulated in alginate/chitosan (AC) microcapsules in static conditions; (white bar) encapsulated in AC microcapsules and placed in the choanoid-fluidized bed bioreactor. Student’s t test. NS: Not significant; TBil: Total bilirubin.
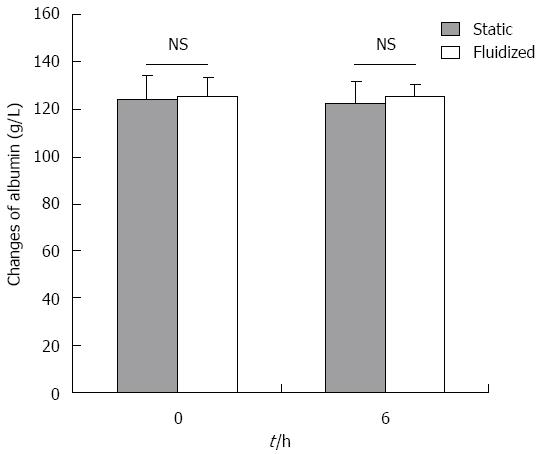
Figure 7 Secretion of albumin from encapsulated hepatocytes in exchanged plasma (n = 5).
The levels are given as g/L (mean ± SD), (gray bar) encapsulated in alginate/chitosan (AC) microcapsules in static conditions; (white bar) encapsulated in AC microcapsules and placed in the choanoid-fluidized bed bioreactor. Student’s t test. NS: Not significant.
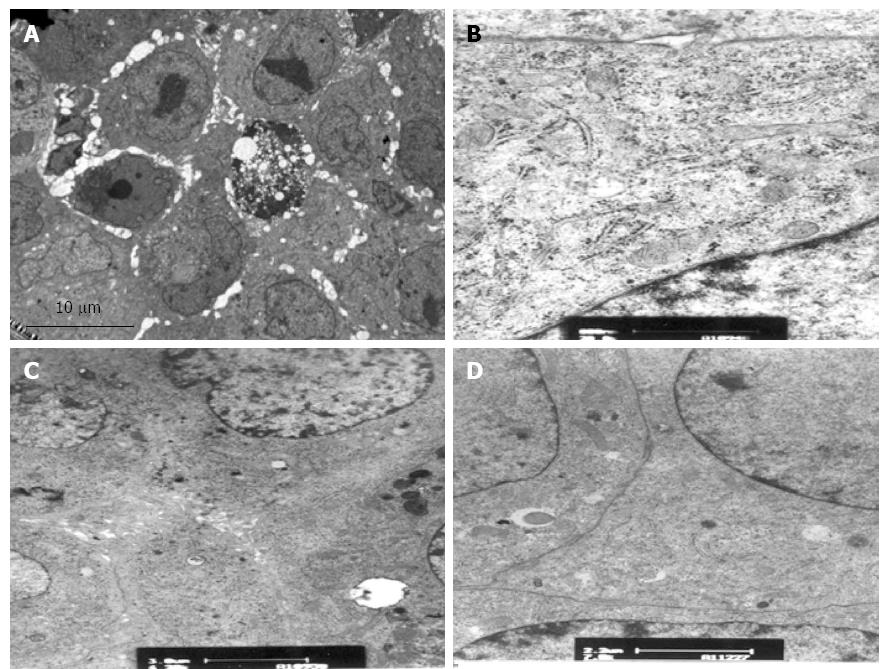
Figure 8 Transmission electron microscopy of alginate/chitosan-encapsulated cells in plasma before testing (× 12000).
A: Low-power view of a single spheroid with an alginate bead shows cohesive colonies of cuboidal cells; B: High-power view showing cytoplasmic organelles, rough endoplasmic reticulum (RER), glycogen granules and mitochondria; C: Extensive microvilli, bile canalicular formation, junctional complexes and desmosomes; D: Tight junction.
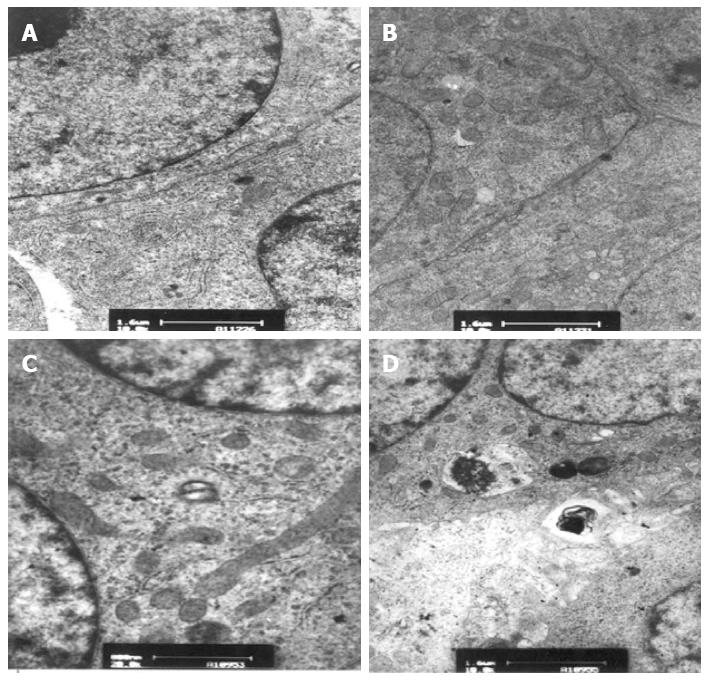
Figure 9 Transmission electron microscopy of alginate/chitosan-encapsulated cells in choanoid-fluidized bed bioreactor after 6 h plasma fluidization (× 12000).
A, B, C: High-power view showing cytoplasmic organelles, rough endoplasmic reticulum (RER), glycogen granules and mitochondria; D: Small amount of vacuolization.
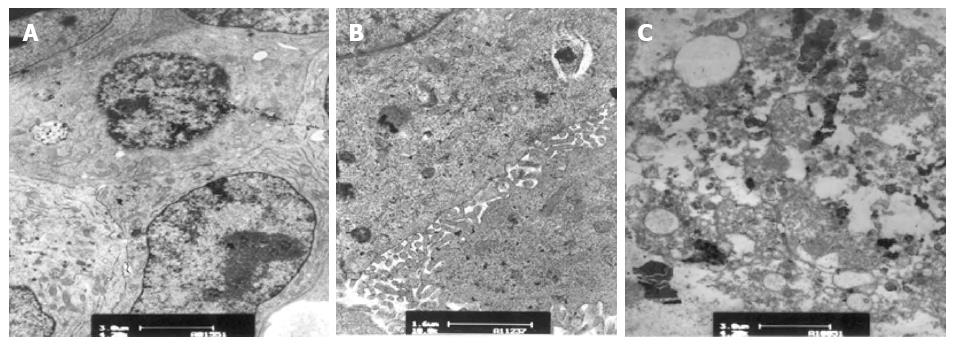
Figure 10 Transmission electron microscopy of alginate/chitosan-encapsulated cells in the choanoid-fluidized bed bioreactor after 6 h of static culture (× 12000).
A: High-power view showing many organelles, mitochondria; B: High–power view showing some microvilli and tight junctions; C: A few nuclei showed shrinkage and some cells showed vacuolar degeneration.
- Citation: Yu CB, Pan XP, Yu L, Yu XP, Du WB, Cao HC, Li J, Chen P, Li LJ. Evaluation of a novel choanoid fluidized bed bioreactor for future bioartificial livers. World J Gastroenterol 2014; 20(22): 6869-6877
- URL: https://www.wjgnet.com/1007-9327/full/v20/i22/6869.htm
- DOI: https://dx.doi.org/10.3748/wjg.v20.i22.6869


