Copyright
©2014 Baishideng Publishing Group Inc.
World J Gastroenterol. Jun 7, 2014; 20(21): 6632-6637
Published online Jun 7, 2014. doi: 10.3748/wjg.v20.i21.6632
Published online Jun 7, 2014. doi: 10.3748/wjg.v20.i21.6632
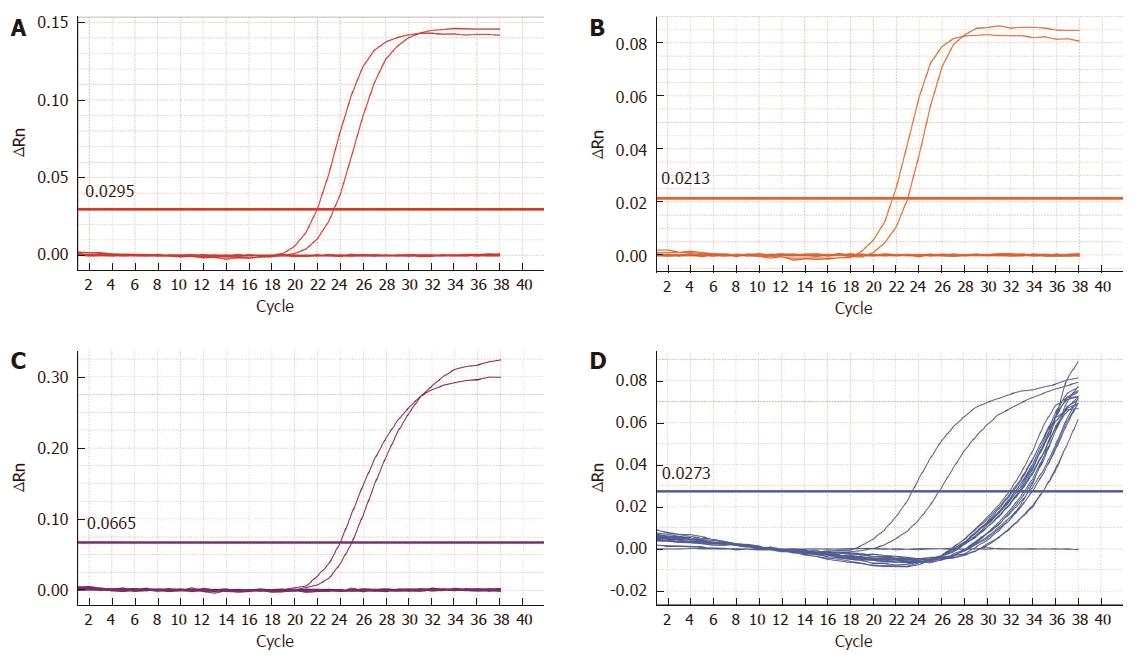
Figure 1 Representative subset of quantitative polymerase chain reaction amplification plots for 55 patients including non-informative cases.
A: Human papilloma virus (HPV) type 16; B: HPV type 18; C: One or more subtypes from the group of 31, 33, 35, 39, 45, 51, 52, 56, 58, 59, 66, 68; D: Internal control (β-globin). The two leftmost curves correspond to the positive controls, horizontal line corresponds to ΔRn threshold. ΔRn: The magnitude of the generated fluorescent signal.
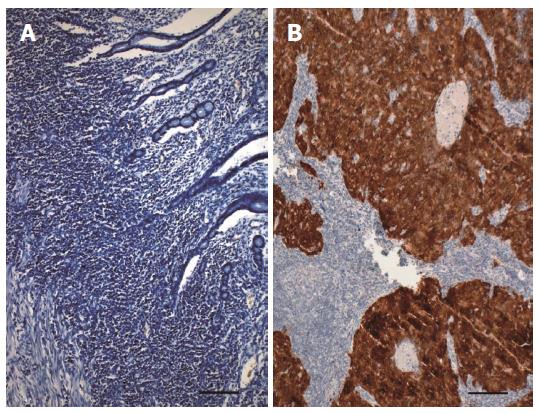
Figure 2 Representative results of immunostaining for p16INK4a protein.
A: Negative immunostaining in gastric adenocarcinoma G3; B: Human papilloma virus-positive squamous cell carcinoma of the oropharynx as the positive control. Scale bar: 200 μm.
- Citation: Snietura M, Waniczek D, Piglowski W, Kopec A, Nowakowska-Zajdel E, Lorenc Z, Muc-Wierzgon M. Potential role of human papilloma virus in the pathogenesis of gastric cancer. World J Gastroenterol 2014; 20(21): 6632-6637
- URL: https://www.wjgnet.com/1007-9327/full/v20/i21/6632.htm
- DOI: https://dx.doi.org/10.3748/wjg.v20.i21.6632


