Copyright
©2014 Baishideng Publishing Group Inc.
World J Gastroenterol. Jun 7, 2014; 20(21): 6420-6424
Published online Jun 7, 2014. doi: 10.3748/wjg.v20.i21.6420
Published online Jun 7, 2014. doi: 10.3748/wjg.v20.i21.6420
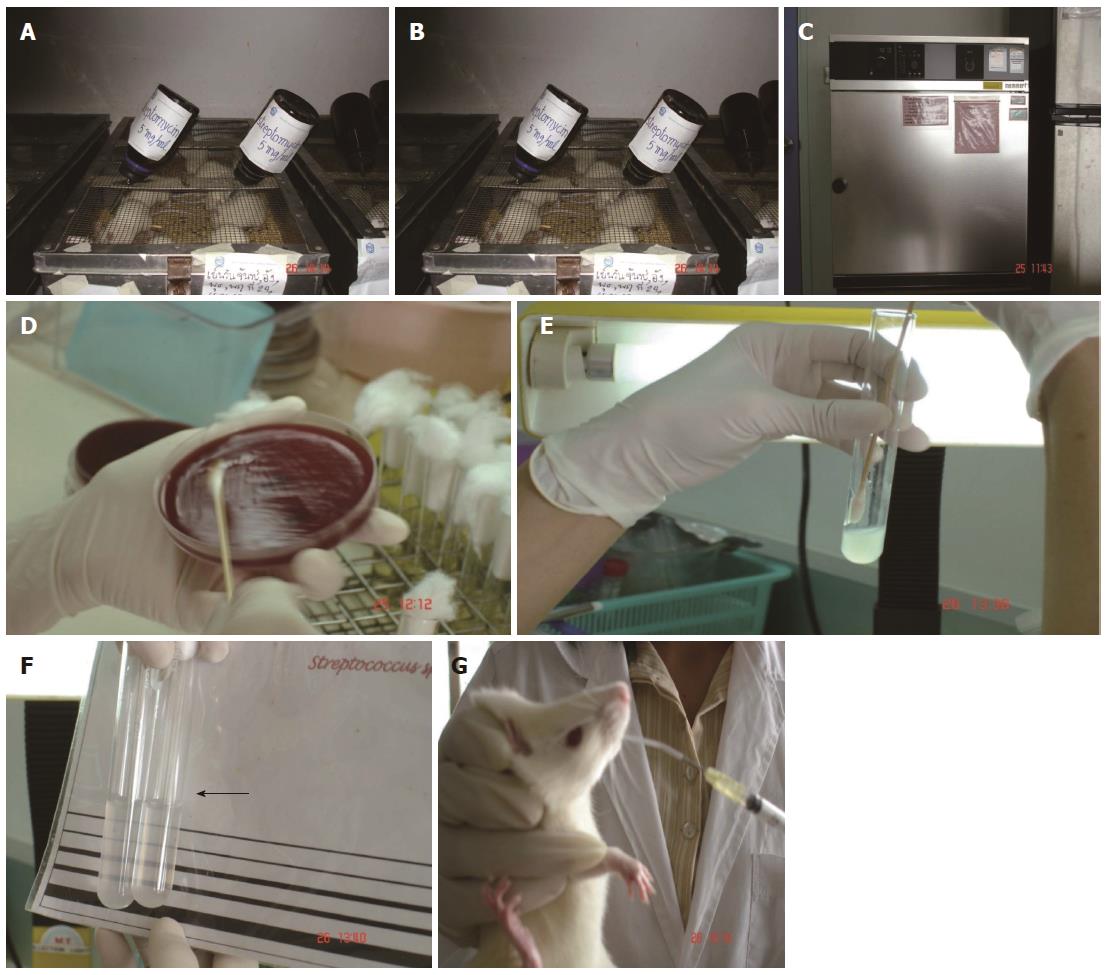
Figure 1 Illustration of Helicobacter pylori rat inoculation.
A: Male Sprague-Dawley rats 120-150 g; B: Pretreatment with streptomycin (5 mg/kg) for three consecutive days; C and D: H. pylori in microaerophilic condition: 5% O2, 50% CO2, 37 °C; E and F: H. pylori 108-1010 CFU/mL, suspended in saline; G: Gavage, 1 mL/rat twice daily at an interval of 4 h, for three consecutive days. H. pylori: Helicobacter pylori.
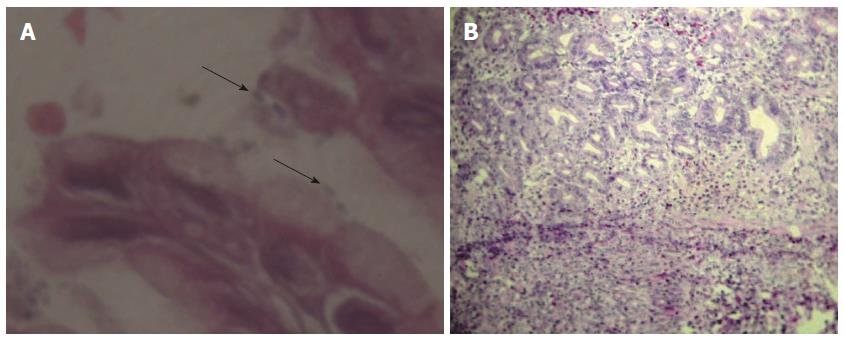
Figure 2 Antral mucosa from Helicobacter pylori-infected rats with hematoxylin and eosin staining.
A: Helicobacter pylori organism in the gastric mucosa (arrow) (600 ×); B: Gastric mucosa with erosion and scattered infiltration of inflammatory cells (250 ×).
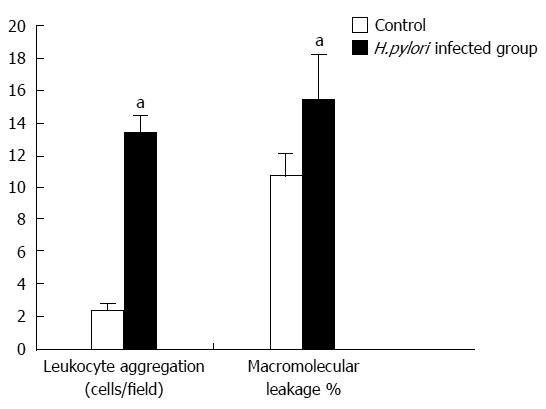
Figure 3 Bar graph of the mean ± SE of adherent leukocytes and macromolecular leakage of control group compared with Helicobacter pylori-infected group.
The leukocyte adhesion and macromolecular leakage in the H. pylori-infected group were significantly increased compared with the control group (aP < 0.01 vs control group). H. pylori: Helicobacter pylori.
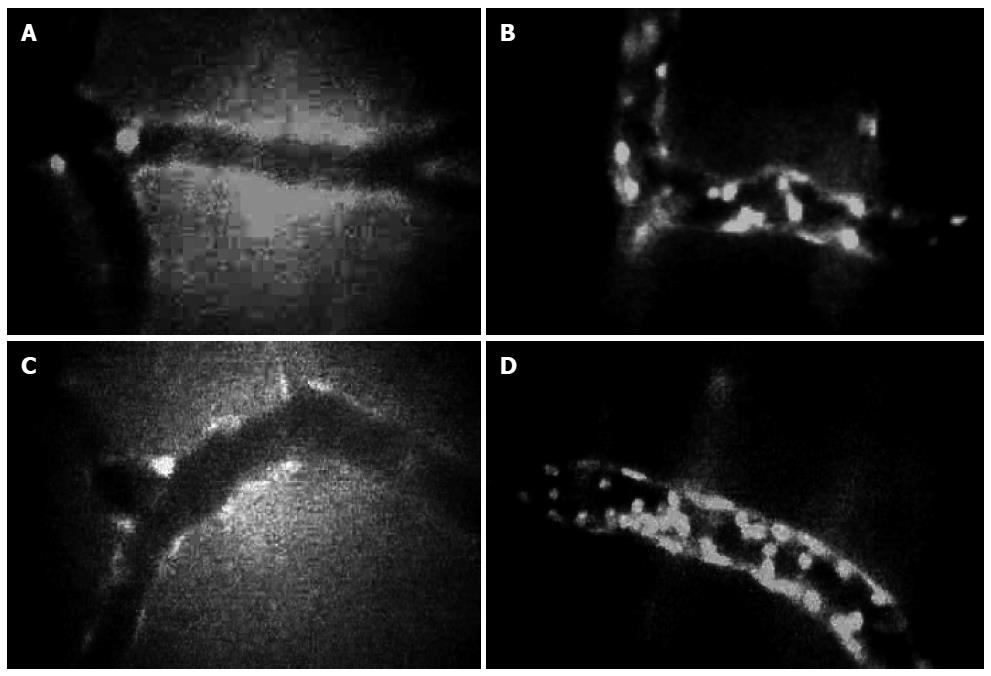
Figure 4 Intravital microscopy demonstrated leukocyte adhesion in control group (A and C) and Helicobacter pylori-infected group (B and D) (40 ×).
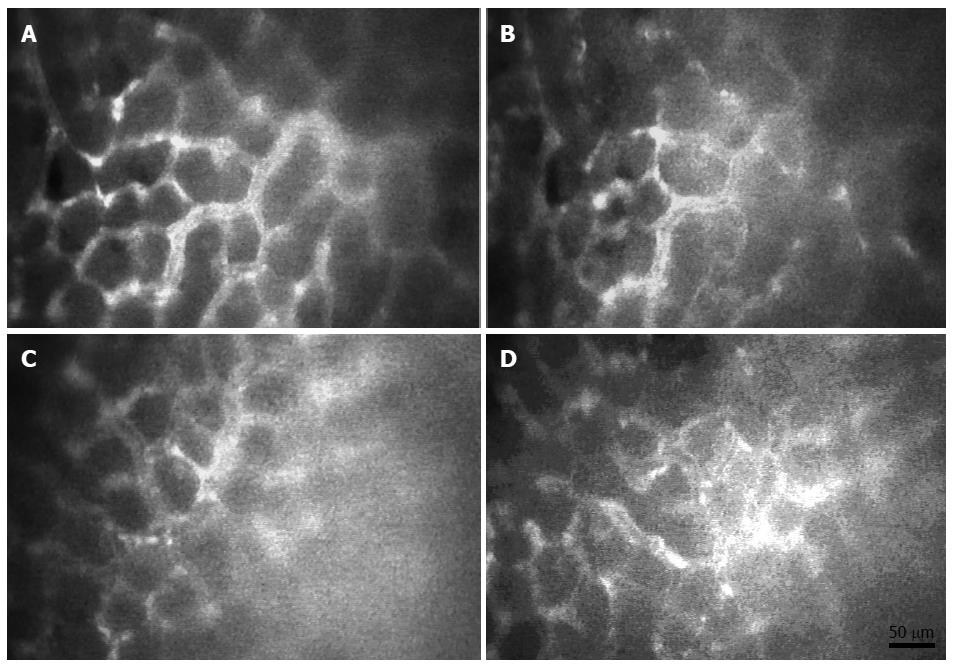
Figure 5 Intravital fluorescent microscopic images (20 ×) demonstrate macromolecular leakage from vessels to the interstitial fluid at 0 and 30 min after injection of control group (A and B) and Helicobacter pylori-infected group (C and D).
FITC-dx-250 injection (0 min) (A and C); same area at 30 min after FITC-dx-250 injection (B and D).
-
Citation: Werawatganon D. Simple animal model of
Helicobacter pylori infection. World J Gastroenterol 2014; 20(21): 6420-6424 - URL: https://www.wjgnet.com/1007-9327/full/v20/i21/6420.htm
- DOI: https://dx.doi.org/10.3748/wjg.v20.i21.6420


