Copyright
©2014 Baishideng Publishing Group Inc.
World J Gastroenterol. May 21, 2014; 20(19): 5849-5858
Published online May 21, 2014. doi: 10.3748/wjg.v20.i19.5849
Published online May 21, 2014. doi: 10.3748/wjg.v20.i19.5849
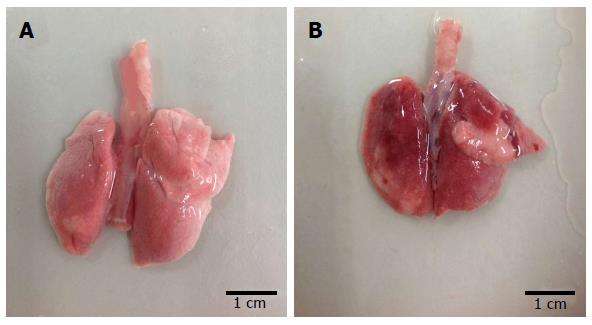
Figure 1 Macroscopic observation of lung morphology in rats.
The chest was opened and the lungs were dissociated 24 h after phosphate buffer saline or lipopolysaccharide instillation. A: Lung of normal rats; B: Lung of model rats.
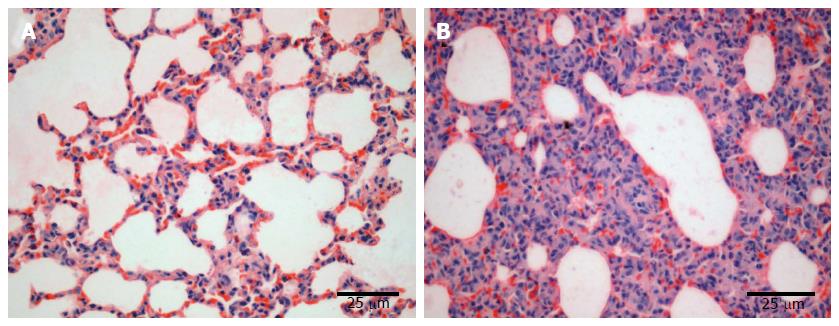
Figure 2 Pulmonary histopathological changes in rats.
Lung tissue specimens were obtained from the normal group (A) and model group (B). Magnification × 400.
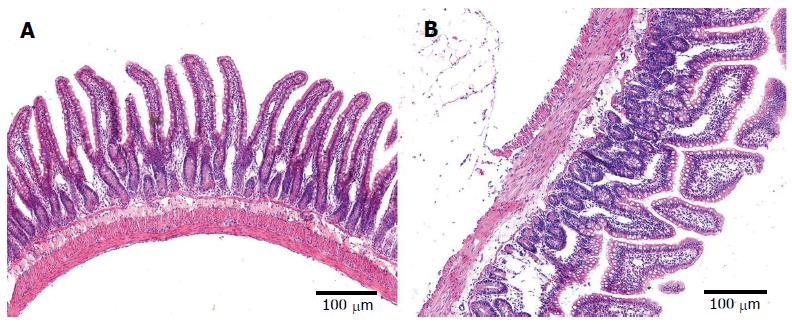
Figure 3 Intestinal histopathological changes in rats.
Intestinal tissue specimens were obtained from the ileum to 5 cm above the cecum in the normal group (A) and model group (B). Magnification × 100.
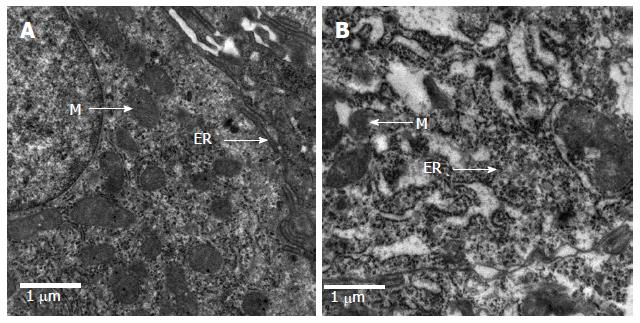
Figure 4 Ultra-structural analysis of intestinal mucosa in rats.
Tissue samples were fixed, cut, stained and examined by transmission electron microscopy. Images are representative electron micrographs of the normal (A) and the model (B) groups. Cell organelles: ER: Endoplasmic reticulum; M: Mitochondria.
Figure 5 Statistically significant flora and percentage of more than twice the number of species are shown at phylum and genus levels.
A: At the phylum level, Fusobacteria was significantly different between the two groups. B: At the genus level, Helicobacter and Roseburia were significantly different between the two groups; Vertical axis represents sequence reads. C: Percentage of all parts at the phylum and genus levels. aP < 0.05 for normal group vs model group. M: Model group; N: Normal group.
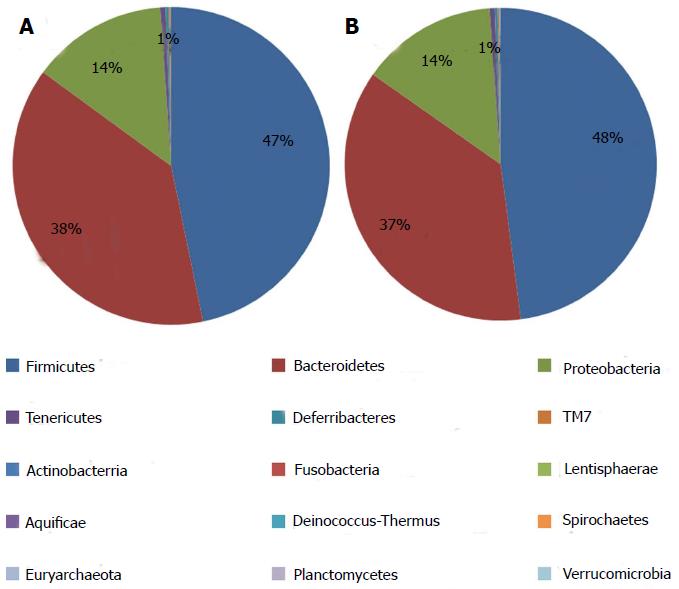
Figure 6 Microbial distributions at phylum level in the samples from the normal and model groups.
Percentages are based on proportions of assignable tags.
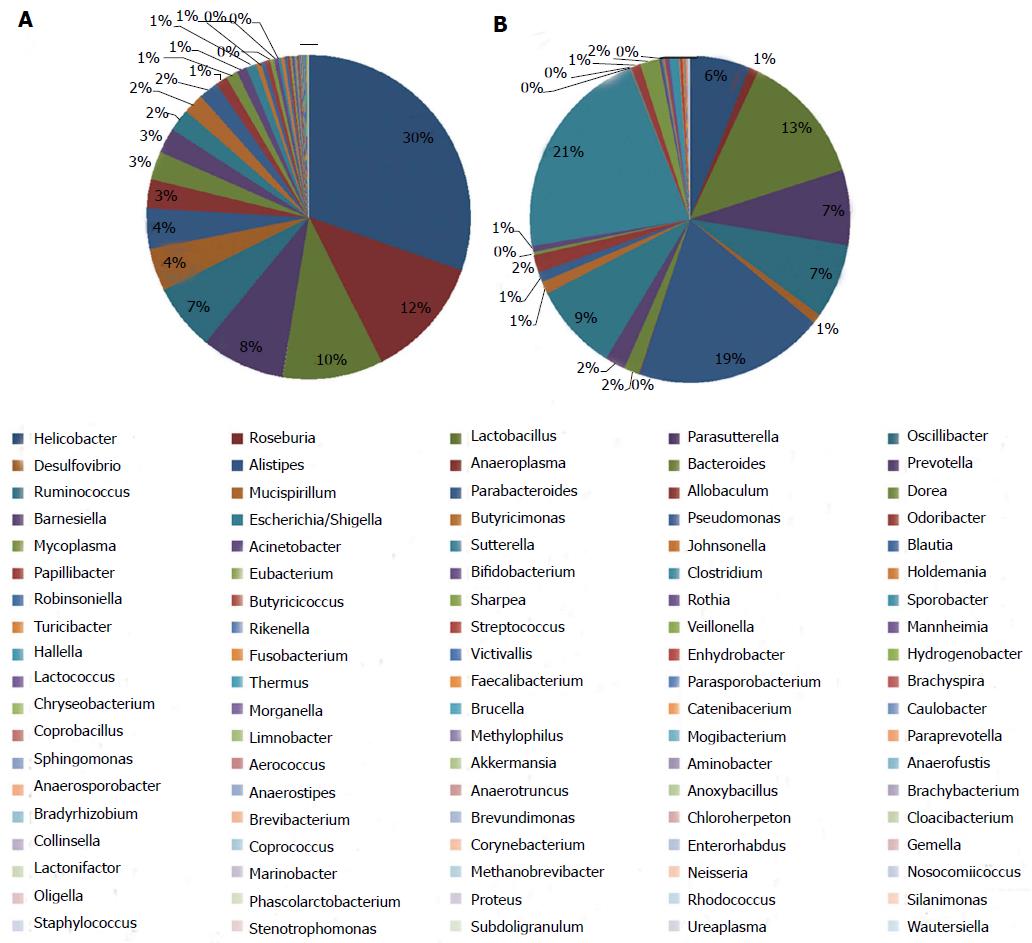
Figure 7 Microbial distributions at genus level in the samples from the normal and model groups.
Percentages are based on proportions of assignable reads.
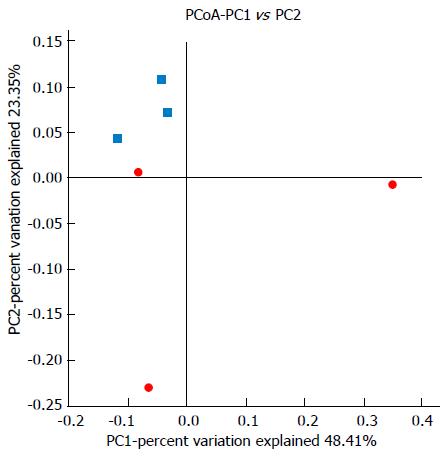
Figure 8 16S rDNA high-throughput sequencing revealed changes in microbial diversity in normal and acute respiratory distress syndrome rats.
Clustering of microbial communities using PCoA of the weighted UniFrac matrix from six samples. The percentage of variation explained by the principal coordinates is indicated on the axes. Subject color coding: blue, samples from the normal group; red, samples from the model group. PCoA: Principal co-ordinate analysis.
- Citation: Li Y, Liu XY, Ma MM, Qi ZJ, Zhang XQ, Li Z, Cao GH, Li J, Zhu WW, Wang XZ. Changes in intestinal microflora in rats with acute respiratory distress syndrome. World J Gastroenterol 2014; 20(19): 5849-5858
- URL: https://www.wjgnet.com/1007-9327/full/v20/i19/5849.htm
- DOI: https://dx.doi.org/10.3748/wjg.v20.i19.5849


