Copyright
©2014 Baishideng Publishing Group Inc.
World J Gastroenterol. May 21, 2014; 20(19): 5826-5838
Published online May 21, 2014. doi: 10.3748/wjg.v20.i19.5826
Published online May 21, 2014. doi: 10.3748/wjg.v20.i19.5826
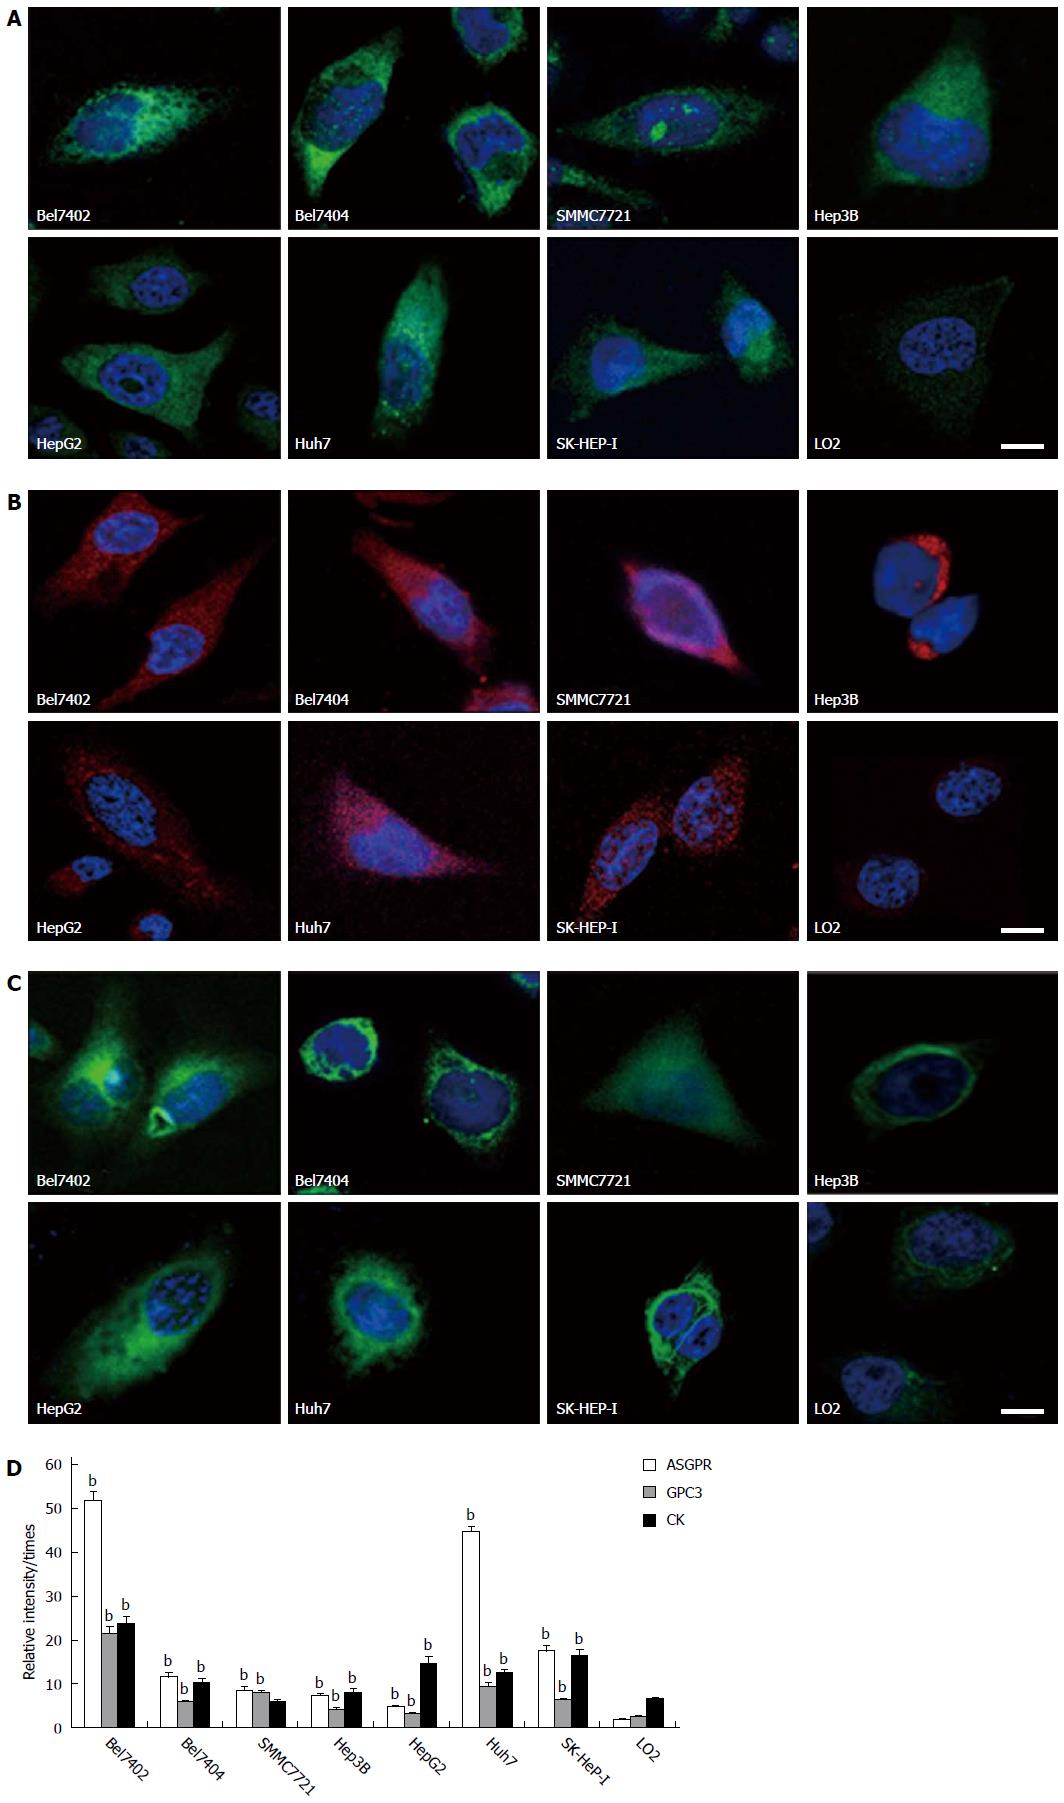
Figure 1 Asialoglycoprotein receptor, glypican-3 and cytokeratin expression, and fluorescence intensities in eight cell lines.
A-C: Representative images of cells on the coverslips with DAPI-stained nuclei (blue) and asialoglycoprotein receptor (ASGPR) staining (green)/glypican-3 (GPC3) staining (red)/cytokeratin (CK) staining (green). The scale bar is 5 μm. D: The bar graph of fluorescence intensities in eight cell lines. Fluorescence intensities were measured using NIH Image J software. Biomarker relative intensities were calculated as the difference between the biomarker staining intensity of the cell and the background intensity. The comparisons between HCC cell lines and the control cell line were analyzed using the Mann-Whitney test (bP < 0.01 vs control).
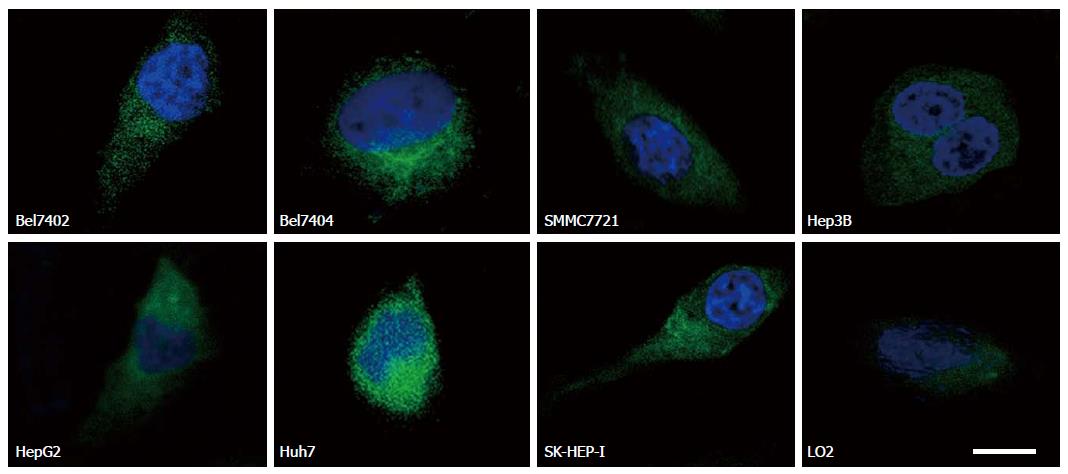
Figure 2 Epithelial cell adhesion molecule expression in eight cell lines.
Representative images of cells on the coverslips with DAPI-stained nuclei (blue) and EpCAM staining (green). The scale bar is 5 μm.
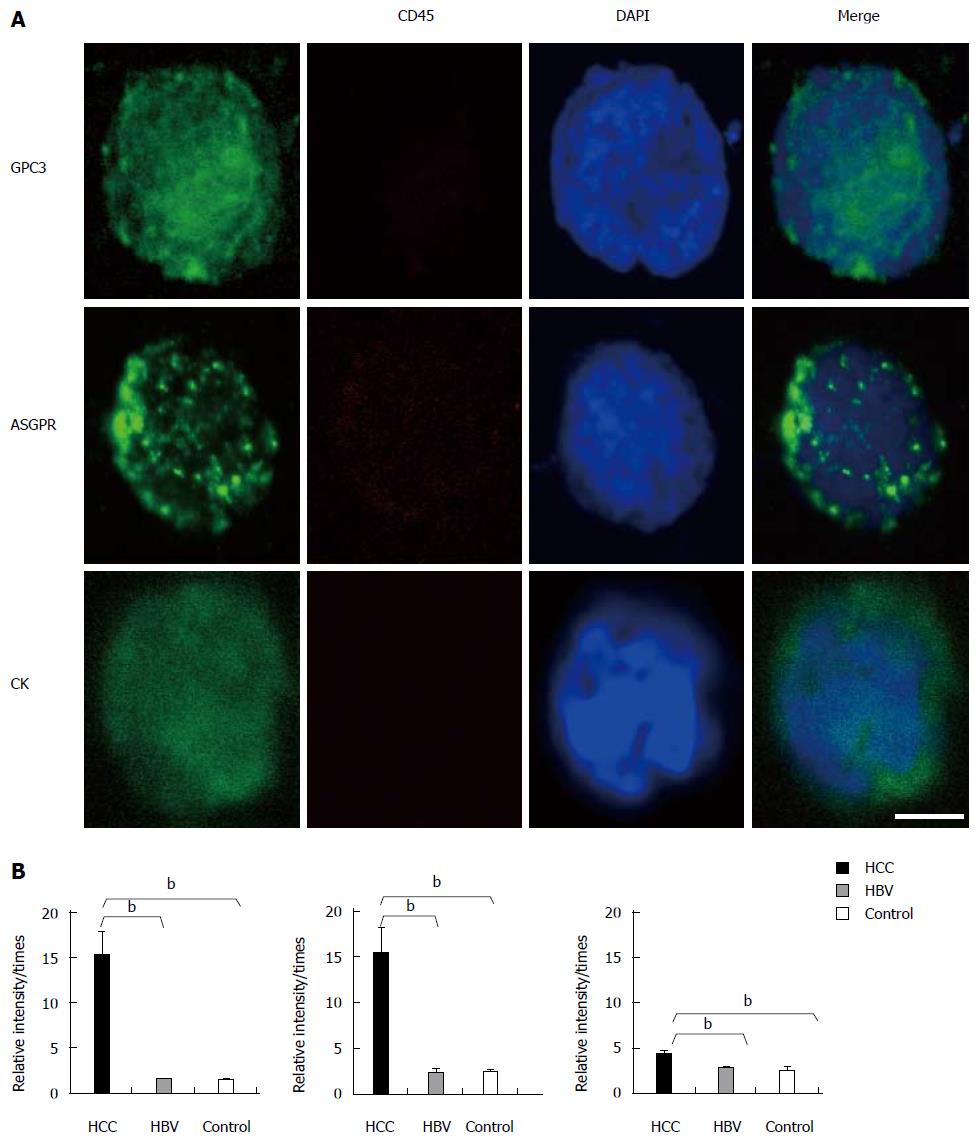
Figure 3 Representative images and fluorescence intensities of cells obtained from patients.
A: Representative image of circulating tumor cells (CTCs) with DAPI-stained nuclei (blue), positive staining of ASGPR/GPC3/CK (green), and negative staining for CD45. The scale bar is 5 μm. A total of 7.5 mL of peripheral blood was collected from each individual, mixed with red blood cell lysis buffer, and incubated with CD45 microbeads to deplete the white blood cells. The remaining cell pellets were fixed on SuperFrost Plus slides for immunofluorescence staining; B: The bar graph of ASGPR/GPC3/CK (from left to right) fluorescence intensities in 30 HCC patients, 7 chronic HBV-infected patients, and 15 healthy controls. Fluorescence intensities were measured using NIH Image J software. Biomarker relative intensities were calculated as the difference between the biomarker staining intensity of the cell and the background intensity. The comparisons between HCC patients and healthy controls were analyzed by the Mann-Whitney test (bP < 0.01 vs control).
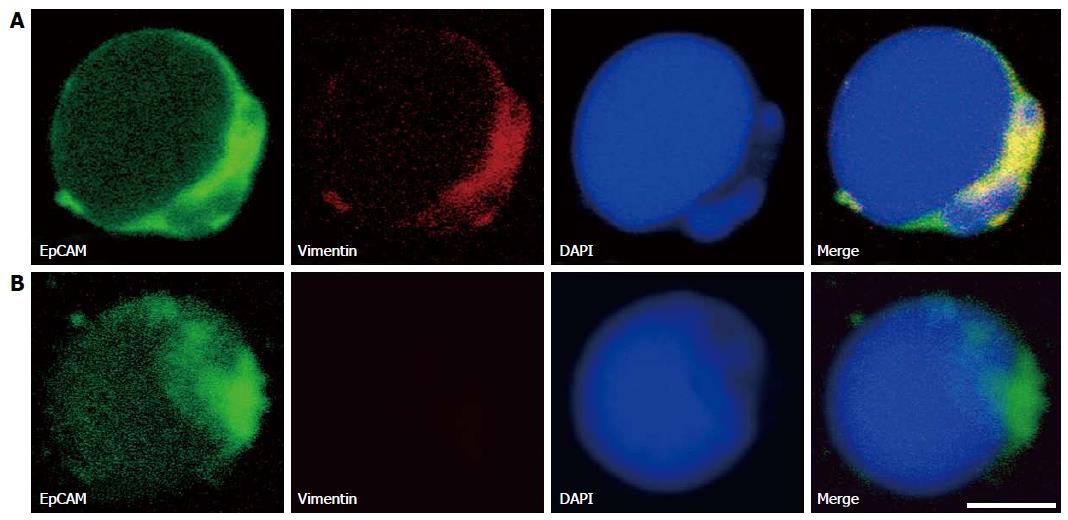
Figure 4 Representative images of epithelial-mesenchymal transition marker-related cells obtained from hepatocellular carcinoma patients.
A: CTCs with dye 4’,6-diamidino-2-phenylindole, (DAPI) -stained nuclei (blue), positive staining of epithelial cell adhesion molecule (EpCAM) (green), and positive staining of vimentin (red). B: CTCs with DAPI-stained nuclei (blue), positive staining of EpCAM (green), and negative staining of vimentin. The scale bar is 5 μm.
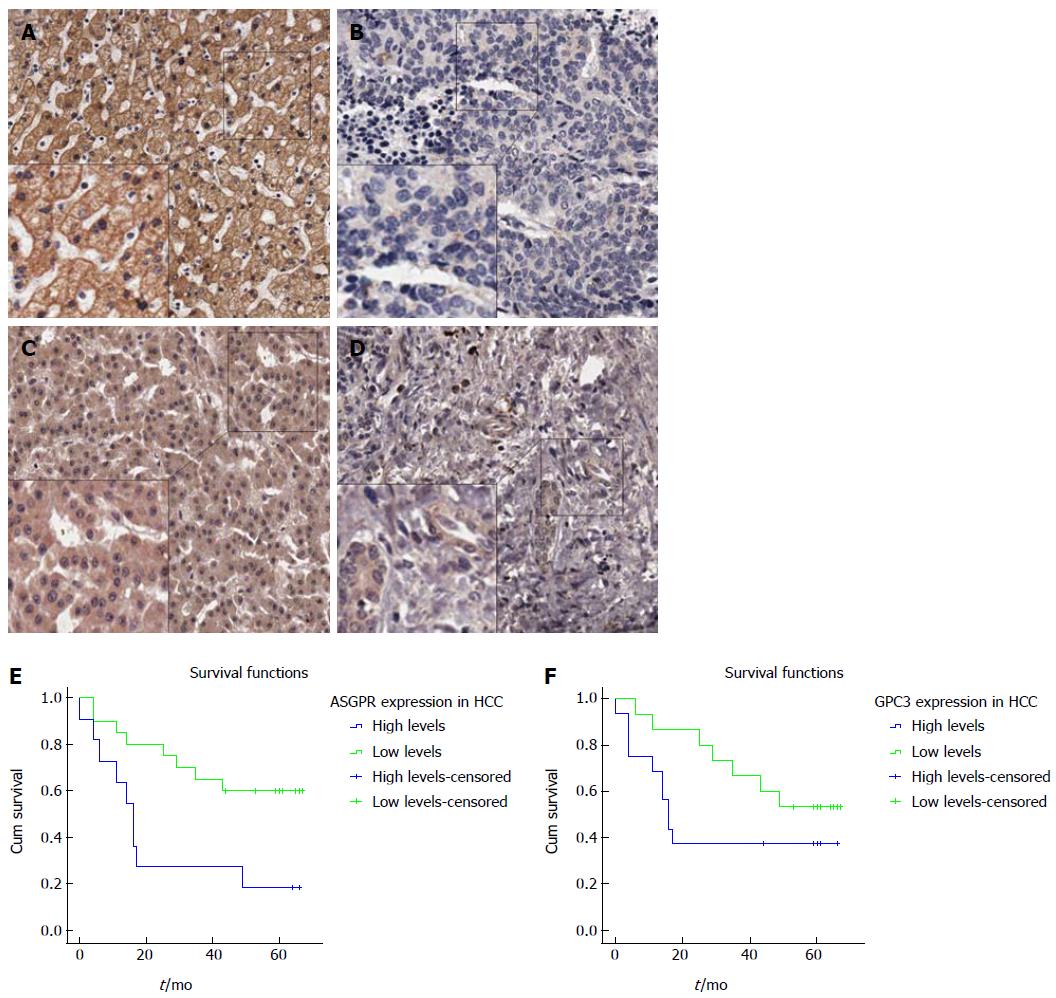
Figure 5 Representative images of asialoglycoprotein receptor/glypican-3 expression on tissue arrays, and Kaplan-Meier survival curves from follow-up studies.
A-B: The expression of ASGPR in HCC (A) and paracarcinomatous (B) tissues. C-D: The expression of GPC3 in HCC (C) and matched paracarcinomatous (D) tissues (A-D: × 100; Inner × 200). The survival curves from six and a half years of follow-up indicate a significant difference between 32 HCC patients with high and low levels of ASGPR (E) and exhibit a trend toward significance between 32 HCC patients with high and low levels of GPC3 (F).
- Citation: Mu H, Lin KX, Zhao H, Xing S, Li C, Liu F, Lu HZ, Zhang Z, Sun YL, Yan XY, Cai JQ, Zhao XH. Identification of biomarkers for hepatocellular carcinoma by semiquantitative immunocytochemistry. World J Gastroenterol 2014; 20(19): 5826-5838
- URL: https://www.wjgnet.com/1007-9327/full/v20/i19/5826.htm
- DOI: https://dx.doi.org/10.3748/wjg.v20.i19.5826


