Copyright
©2014 Baishideng Publishing Group Co.
World J Gastroenterol. May 7, 2014; 20(17): 5104-5112
Published online May 7, 2014. doi: 10.3748/wjg.v20.i17.5104
Published online May 7, 2014. doi: 10.3748/wjg.v20.i17.5104
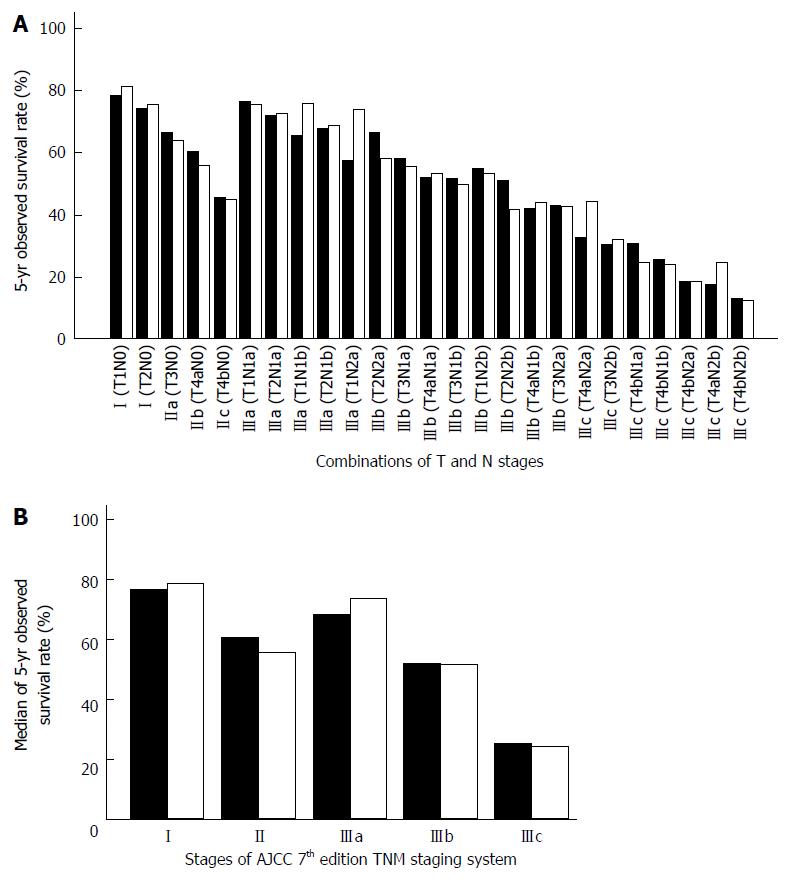
Figure 1 Relationship between survival of colorectal cancer patients and stages of the American Joint Committee on Cancer 7th edition tumor node metastasis staging system.
A: The 5-year observed survival rate of colorectal cancer patients according to 25 combinations of T and N stages of the American Joint Committee on Cancer (AJCC) 7th edition tumor node metastasis (TNM) staging system; B: The median 5-year observed survival rate of colorectal cancer patients for overall stages (I, II, IIIa, IIIb and IIIc) according to the 7th edition of the AJCC TNM staging system. Colon cancer is represented by the solid black grids. Rectal cancer is represented by the white grids (Surveillance, Epidemiology, and End Results open data).
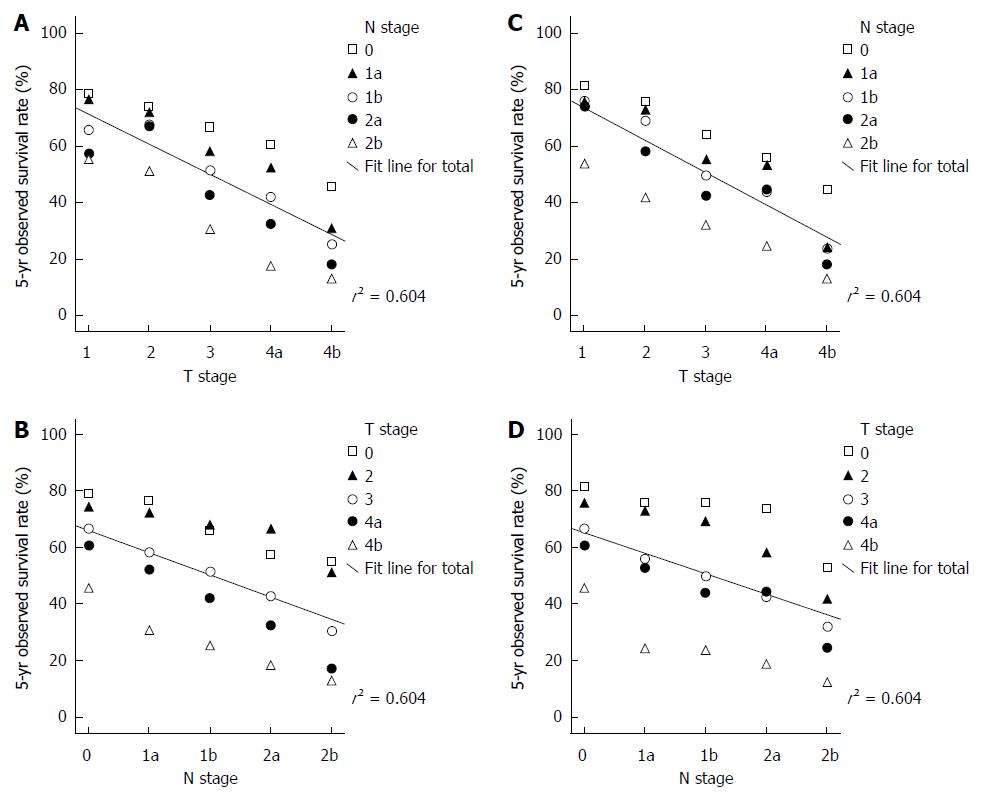
Figure 2 Scatter plots for T stage, N stage and the 5-year observed survival of colorectal cancer patients.
A: Highlight of the T stage of colon cancer; B: Highlight of the N stage of colon cancer; C: Highlight of the T stage of rectal cancer; D: Highlight of the N stage of rectal cancer.
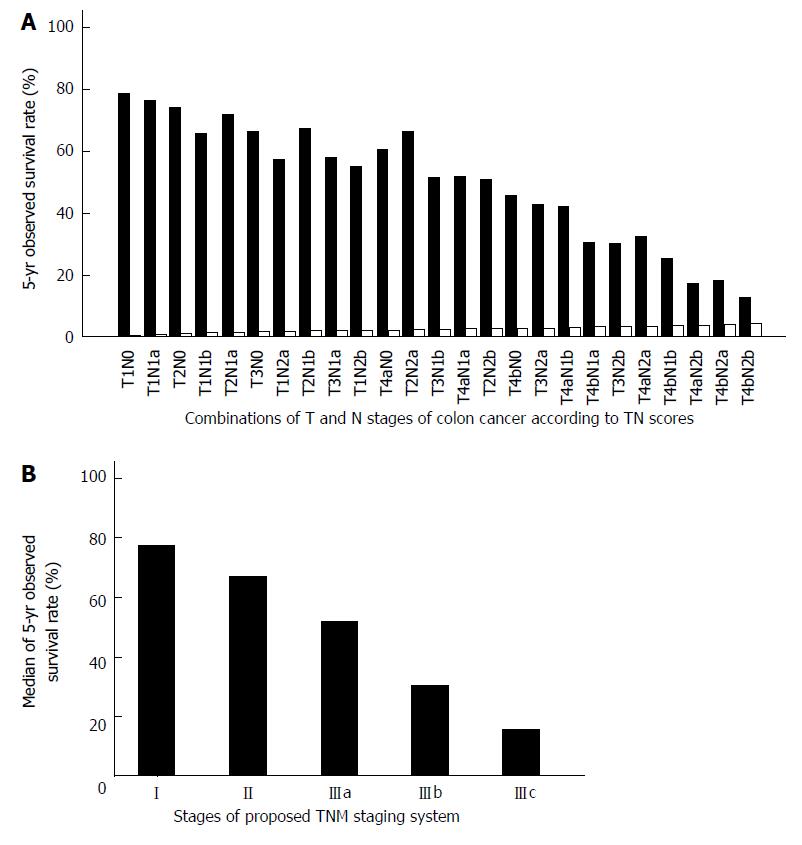
Figure 3 Relationship between survival of colon cancer patients and stages of the revised tumor node metastasis staging system.
A: The 5-year observed survival rate of colon cancer patients for combinations of T and N stages according to TN scores. The observed survival rate is represented by the solid black grids. TN scores are represented by the white grids; B: The median 5-year observed survival rate of colon cancer patients for the proposed tumor node metastasis (TNM) staging system according to TN scores.
Figure 4 Relationship between survival of rectal cancer patients and stages of the revised tumor node metastasis staging system.
A: The 5-year observed survival rate of rectal cancer patients for combinations of T and N stages according to TN scores. The observed survival rate is represented by the grey grids. TN scores are represented by the white grids; B: The median 5-year observed survival rate of rectal cancer patients for the proposed tumor node metastasis (TNM) staging system according to TN scores.
- Citation: Li J, Guo BC, Sun LR, Wang JW, Fu XH, Zhang SZ, Poston G, Ding KF. TNM staging of colorectal cancer should be reconsidered by T stage weighting. World J Gastroenterol 2014; 20(17): 5104-5112
- URL: https://www.wjgnet.com/1007-9327/full/v20/i17/5104.htm
- DOI: https://dx.doi.org/10.3748/wjg.v20.i17.5104


