Copyright
©2014 Baishideng Publishing Group Co.
World J Gastroenterol. Apr 21, 2014; 20(15): 4382-4392
Published online Apr 21, 2014. doi: 10.3748/wjg.v20.i15.4382
Published online Apr 21, 2014. doi: 10.3748/wjg.v20.i15.4382
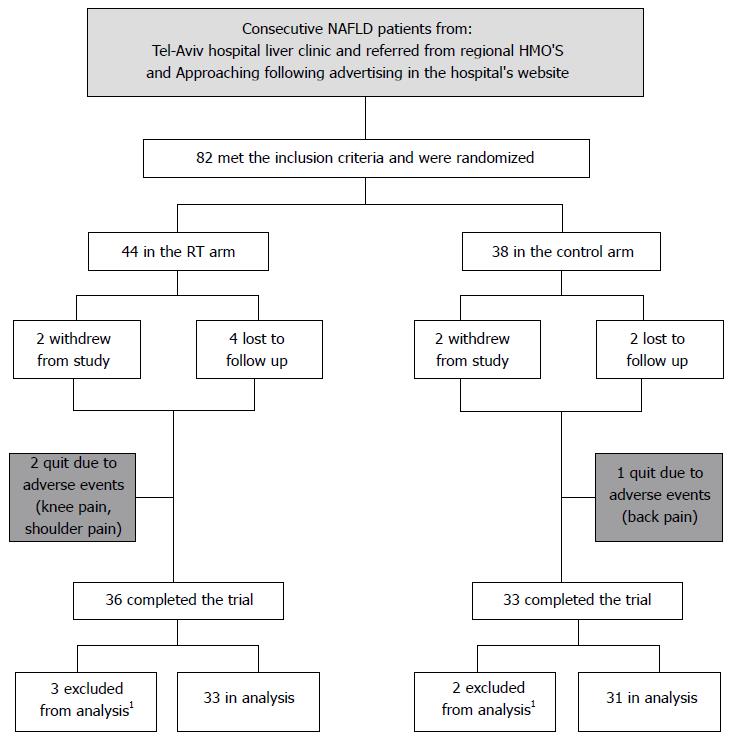
Figure 1 Flow chart of trial participants.
1Excluded from analysis due to > 3 kg weight change. RT: Resistance training; NAFLD: Non alcoholic liver disease.
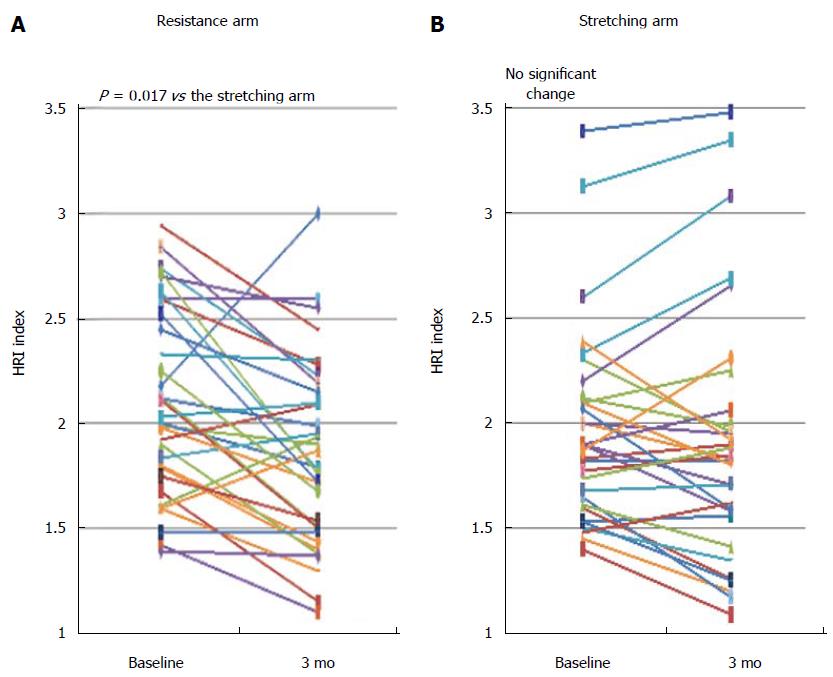
Figure 2 Change (absolute) in hepatorenal-ultrasound index values between baseline and end of trial by treatment arm.
A: Resistance arm; B: Stretching arm. Each line represents a single patient. HRI: Hepatorenal-ultrasound index.
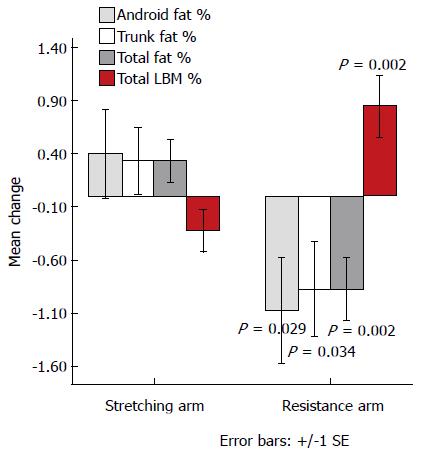
Figure 3 Change (absolute) in body composition parameters between baseline and end of trial by treatment arm.
P represents the significance of difference between resistance and stretching arm for each parameter (n = 55). LBM: Lean body mass.
- Citation: Zelber-Sagi S, Buch A, Yeshua H, Vaisman N, Webb M, Harari G, Kis O, Fliss-Isakov N, Izkhakov E, Halpern Z, Santo E, Oren R, Shibolet O. Effect of resistance training on non-alcoholic fatty-liver disease a randomized-clinical trial. World J Gastroenterol 2014; 20(15): 4382-4392
- URL: https://www.wjgnet.com/1007-9327/full/v20/i15/4382.htm
- DOI: https://dx.doi.org/10.3748/wjg.v20.i15.4382


