Copyright
©2014 Baishideng Publishing Group Co.
World J Gastroenterol. Apr 14, 2014; 20(14): 4001-4010
Published online Apr 14, 2014. doi: 10.3748/wjg.v20.i14.4001
Published online Apr 14, 2014. doi: 10.3748/wjg.v20.i14.4001
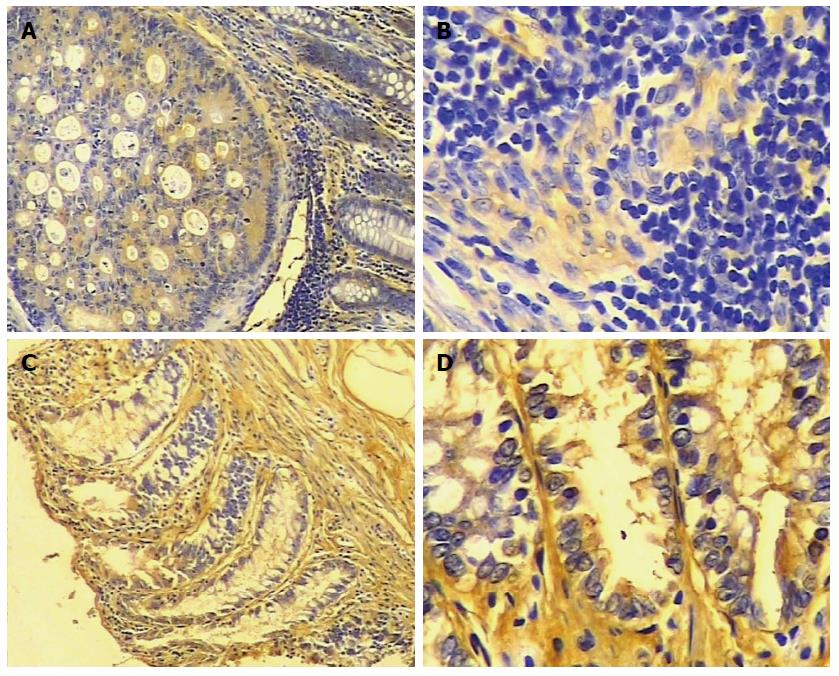
Figure 1 Immunohistochemistry of epithelial membrane protein 1 protein in colorectal carcinoma and adjacent normal tissue.
A and B: Representative sample of colorectal carcinoma (A: SP × 100, B: SP × 400). There is little staining for epithelial membrane protein 1 (EMP1); C and D: normal colorectal tissue (C: SP × 100, D: SP × 400). There is intense yellow and yellow-brown staining of EMP1.
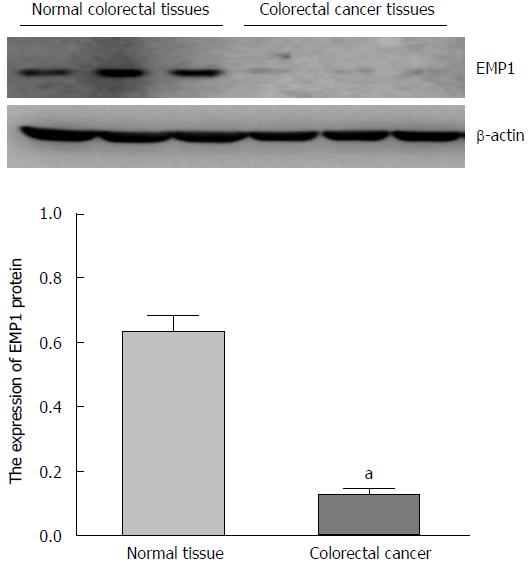
Figure 2 Epithelial membrane protein 1 protein in colorectal carcinoma and normal tissue detected by Western blot.
Upper panel, representative blots of normal (left) and cancer colorectal (right) tissue. Lower panel, summary of all samples. Epithelial membrane protein 1 (EMP1) levels are significantly less in colorectal cancer relative to control, aP < 0.05.
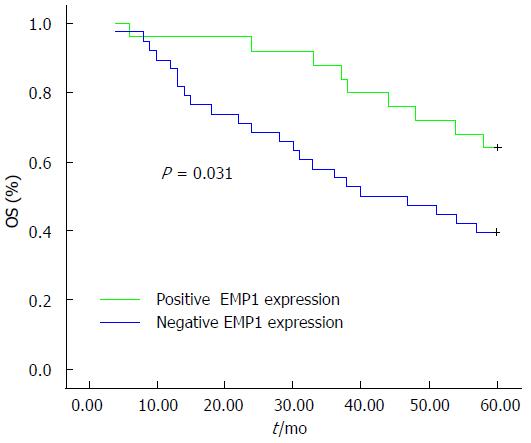
Figure 3 Relationship between epithelial membrane protein 1 expression and five-year survival in colorectal carcinoma by Kaplan-Meier analysis.
Overall survival is higher in epithelial membrane protein 1 (EMP1)-positive patients relative to EMP1-negative patients.
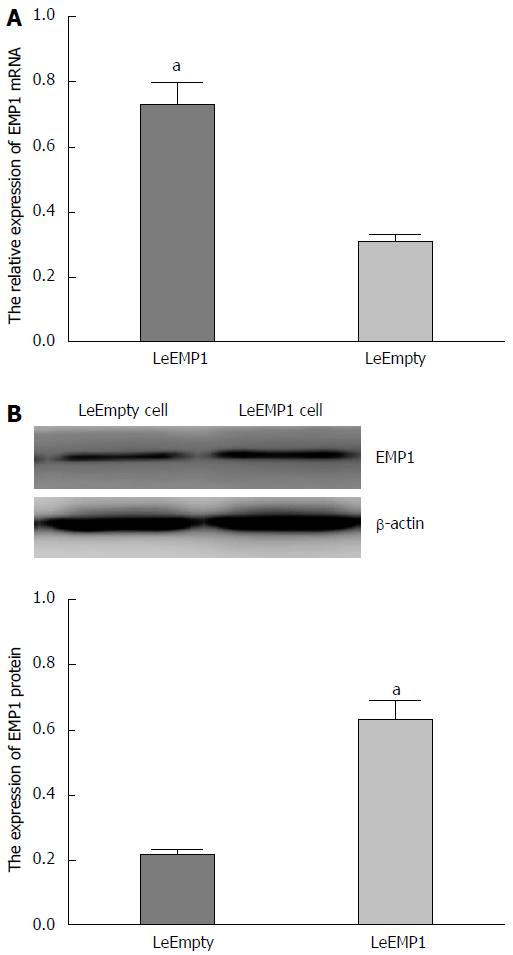
Figure 4 Expression and identification of the epithelial membrane protein 1 gene.
A: Reverse transcription-polymerase chain reaction for epithelial membrane protein 1 (EMP1) in LeEmpty cells vs LeEMP1 cells; B: Sample Western blots for EMP1 and actin (loading control) in LeEmpty and LeEMP1 cells (top). Summary of Western blot data for EMP1 protein expression (bottom), aP < 0.05 vs LeEMP1.
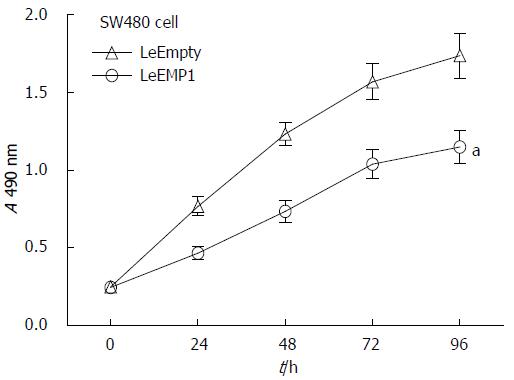
Figure 5 Effects of epithelial membrane protein 1 overexpression on cell proliferation.
MTT assay time-course for LeEmpty and LeEMP1 cells. Cells overexpressing EMP1 have a significantly decreased rate of proliferation relative to control cells, aP < 0.05. EMP1: Epithelial membrane protein 1.
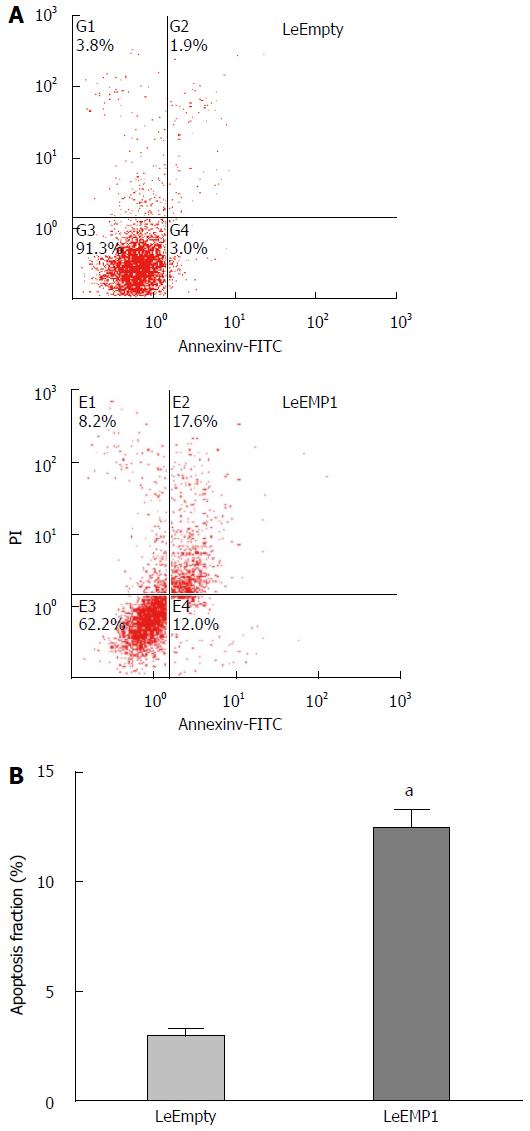
Figure 6 Effects of epithelial membrane protein 1 overexpression on cell apoptosis.
A: Cells were stained with 5 μL annexin V-FITC and 10 μL PI (20 μg/mL). Samples were acquired on a FACScan flow cytometer and 10000 cells analyzed with Cellquest software; B: Colorectal cancer cells overexpressing epithelial membrane protein 1 (LeEMP1) exhibit significantly more apoptosis than empty vector transfected cells (LeEmpty), aP < 0.05
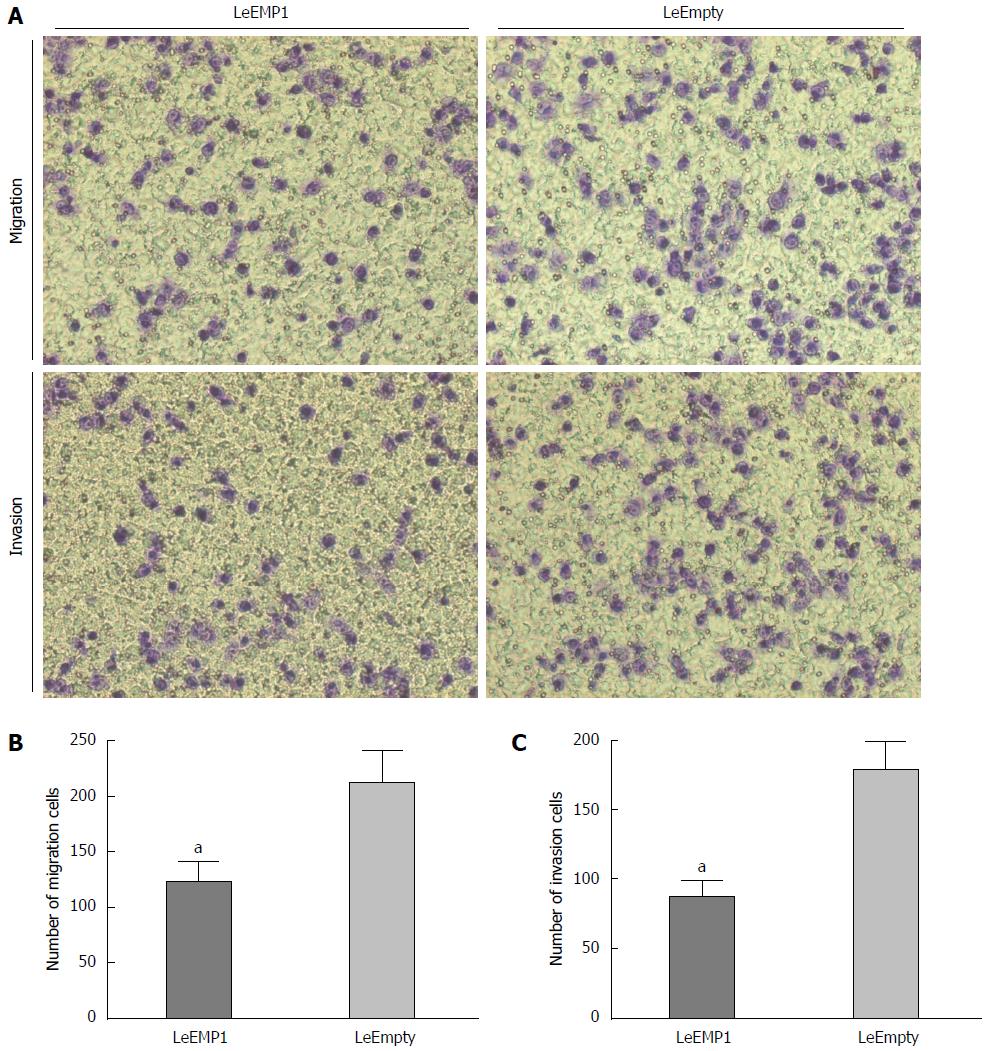
Figure 7 Effects of epithelial membrane protein 1 overexpression on cell migration and invasion.
A: Histological sections of cell migration and invasion in LeEmpty and LeEMP1 cells; B: The number of migrating cells is significantly greater in LeEmpty cells than in LeEMP1 cells; C: Number of invading cells is greater in LeEmpty than in LeEMP1 transfected cells, aP < 0.05. EMP1: Epithelial membrane protein 1.
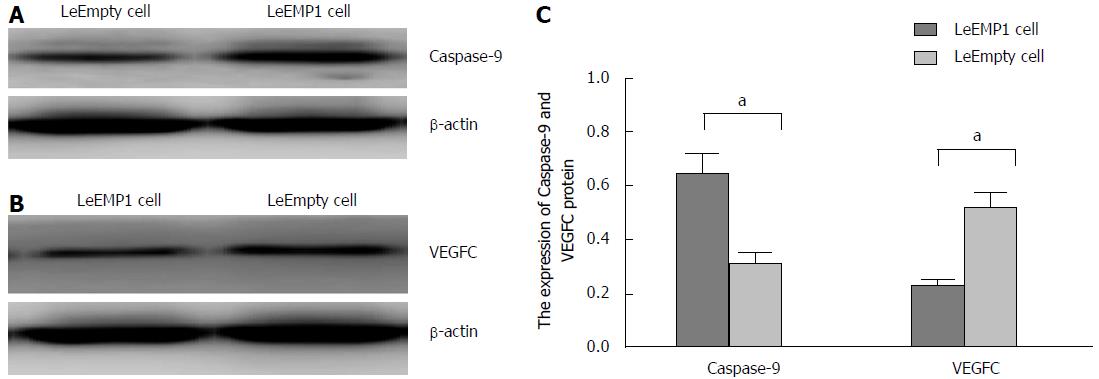
Figure 8 Effects of epithelial membrane protein 1 overexpression on caspase-9 and vascular endothelial growth factor-factor C expression.
A: Sample blot for caspase-9 and actin (loading control) of colorectal cancer cells transfected with LeEMP1 and LeEmpty; B: Sample blot for vascular endothelial growth factor-factor C (VEGFC) and actin; C: Quantification of caspase-9 and VEGFC expression in LeEMP1 and LeEmpty cells. aP < 0.05 beteween the two groups.
- Citation: Sun GG, Wang YD, Cui DW, Cheng YJ, Hu WN. Epithelial membrane protein 1 negatively regulates cell growth and metastasis in colorectal carcinoma. World J Gastroenterol 2014; 20(14): 4001-4010
- URL: https://www.wjgnet.com/1007-9327/full/v20/i14/4001.htm
- DOI: https://dx.doi.org/10.3748/wjg.v20.i14.4001


