Copyright
©2014 Baishideng Publishing Group Co.
World J Gastroenterol. Apr 7, 2014; 20(13): 3655-3662
Published online Apr 7, 2014. doi: 10.3748/wjg.v20.i13.3655
Published online Apr 7, 2014. doi: 10.3748/wjg.v20.i13.3655
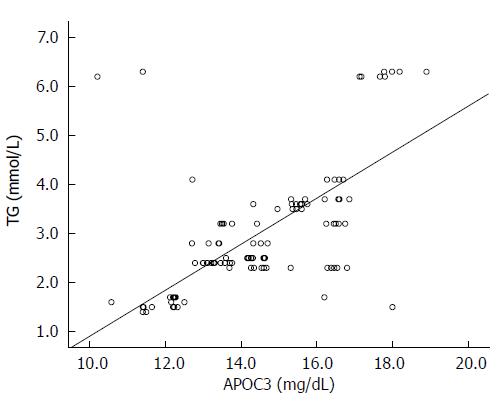
Figure 1 Relationship between serum triglycerides level and plasma apolipoprotein C3 concentration.
TG: Triglycerides. r and P values were calculated using a linear regression model (r = 0.706, P = 0.000).
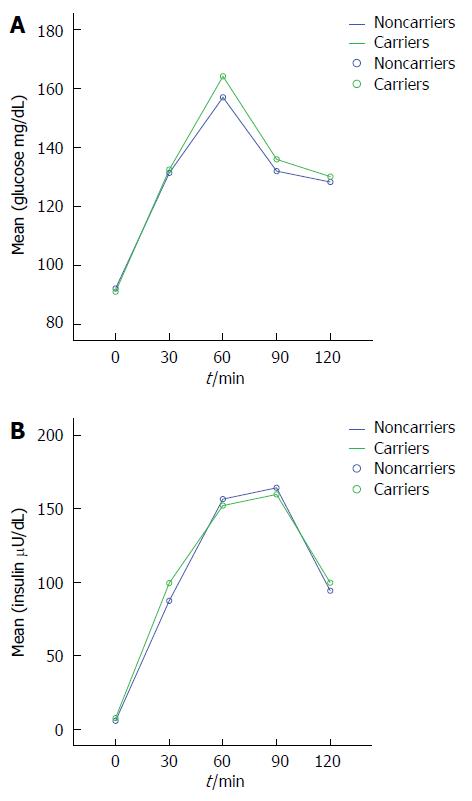
Figure 2 Comparison of glucose (A) and insulin (B) levels between noncarrier and carrier groups in the oral glucose tolerance test.
P values were calculated by paired samples t test (P = 0.137, 0.537).
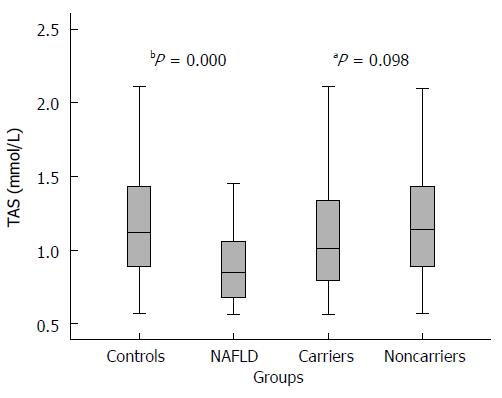
Figure 3 Comparison of total antioxidant status in different groups.
aP and bP were tested by Student’s unpaired t test, aP = 0.098 vs carriers, bP < 0.01 vs controls, respectively. TAS: Total antioxidant status.
- Citation: Niu TH, Jiang M, Xin YN, Jiang XJ, Lin ZH, Xuan SY. Lack of association between apolipoprotein C3 gene polymorphisms and risk of nonalcoholic fatty liver disease in a Chinese Han population. World J Gastroenterol 2014; 20(13): 3655-3662
- URL: https://www.wjgnet.com/1007-9327/full/v20/i13/3655.htm
- DOI: https://dx.doi.org/10.3748/wjg.v20.i13.3655


