Copyright
©2014 Baishideng Publishing Group Co.
World J Gastroenterol. Mar 28, 2014; 20(12): 3356-3363
Published online Mar 28, 2014. doi: 10.3748/wjg.v20.i12.3356
Published online Mar 28, 2014. doi: 10.3748/wjg.v20.i12.3356
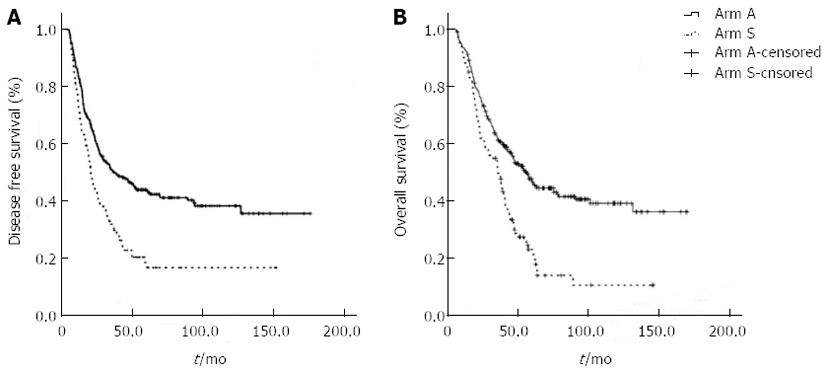
Figure 1 Kaplan-Meier curves of disease-free survival (A) and overall survival (B) in Arm A and Arm S.
P-value by Log-rank test. A: Disease-free survival (DFS): 41.5 mo vs 24.4 mo, P = 0.007; B: Overall survival: 63.0 mo vs 42.9 mo, P = 0.001.
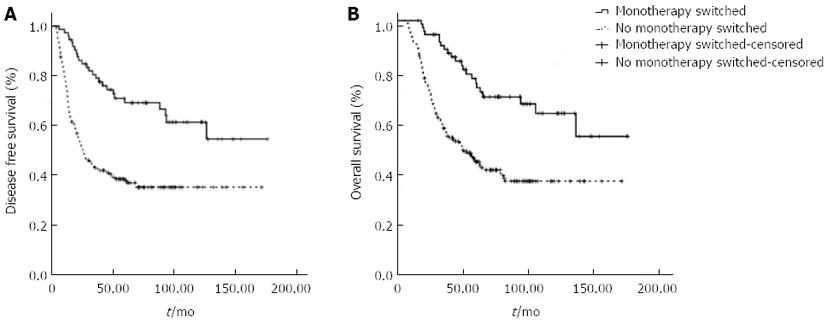
Figure 2 Kaplan-Meier curves of disease-free survival (A) and overall survival (B) in patients with monotherapy switched or not.
P-value by Log-rank test. A: Disease-free survival: Not reached vs 25.4 mo, P = 0.000; B: Overall survival: Not reached vs 49.4 mo, P = 0.005.
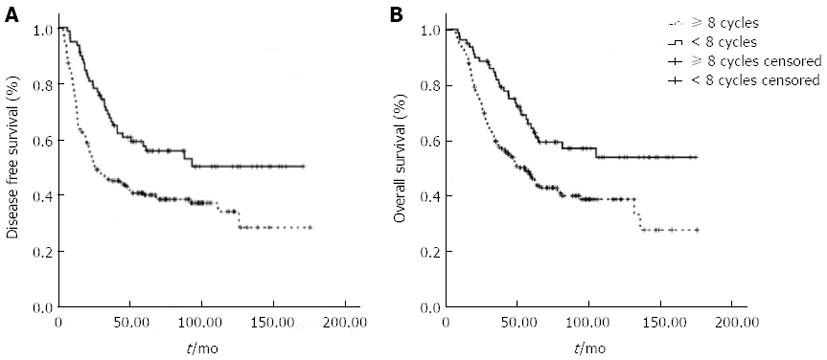
Figure 3 Kaplan-Meier curves of disease-free survival (A) and overall survival (B) in patients treated with ≥ 8 cycles or not.
P-value by Log-rank test. A: Disease-free survival: Not reached vs 25.8 mo, P = 0.001; B: Overall survival: Not reached vs 56.1 mo, P = 0.002.
- Citation: Deng W, Wang QW, Zhang XT, Lu M, Li J, Li Y, Gong JF, Zhou J, Lu ZH, Shen L. Retrospective analysis of adjuvant chemotherapy for curatively resected gastric cancer. World J Gastroenterol 2014; 20(12): 3356-3363
- URL: https://www.wjgnet.com/1007-9327/full/v20/i12/3356.htm
- DOI: https://dx.doi.org/10.3748/wjg.v20.i12.3356


