Copyright
©2014 Baishideng Publishing Group Co.
World J Gastroenterol. Mar 28, 2014; 20(12): 3125-3134
Published online Mar 28, 2014. doi: 10.3748/wjg.v20.i12.3125
Published online Mar 28, 2014. doi: 10.3748/wjg.v20.i12.3125
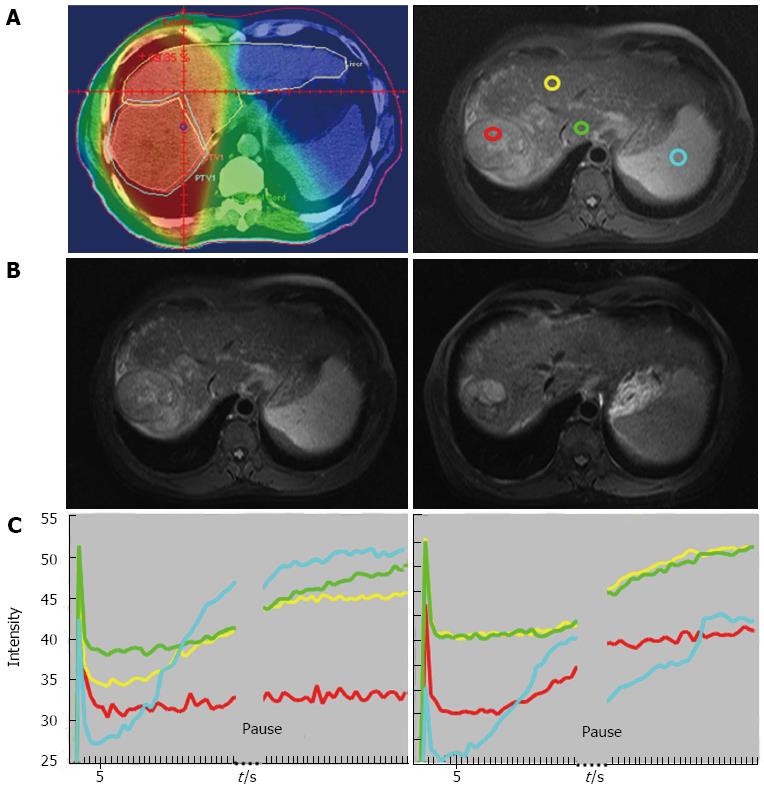
Figure 1 Forty-nine-year-old man with good local response.
A: Isodose distribution and region of interests (ROIs): Left panel: Isodose distribution on center section of radiation treatment planning. Red: 45 Gy; orange: 40 Gy; yellow: 30 Gy; green: 15 Gy and blue: < 15 Gy. Right panel: ROIs on MRI before RT: red: tumor with strongest enhancement; yellow: non-tumor liver parenchyma receiving 30 Gy; green: non-tumor liver parenchyma receiving 15 Gy; blue: spleen; B: T1 weighted contrast-enhanced MRI before RT (left panel, the site corresponding to the right panel of (A) and after RT (right panel). Arrows indicate tumor margins; C: Time Intensity Curve of ROIs before RT (left panel) and at week 2 of RT (right panel). Red: tumor; yellow: 30 Gy; green: 15 Gy; blue: spleen. The curve of spleen is deviated after pause for respiration due to interference by lung perfusion. The initial spike due to refocusing artifact will not be counted into analysis. (From reference [23], reprint with permission).
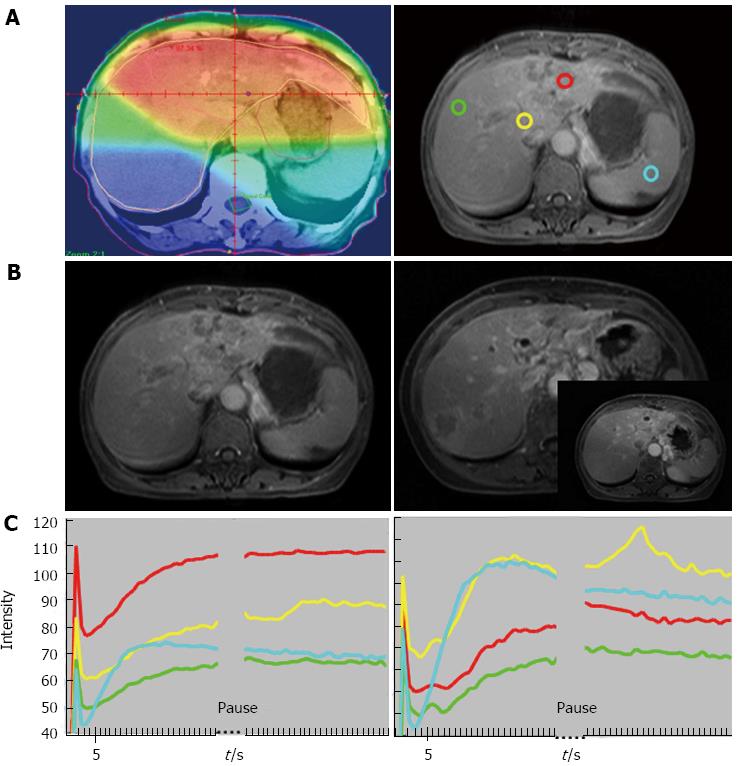
Figure 2 Sixty-four-year-old woman with good local response and intrahepatic recurrence outside of RT fields.
A: Isodose distribution and region of interests (ROIs): Left panel: isodose distribution on center section of radiation treatment planning. Red: 45 Gy; orange: 40 Gy; yellow: 30 Gy; green: 15 Gy; blue: < 15 Gy. Right panel: ROIs on magnetic resonance imaging (MRI) before RT: red: tumor with strongest enhancement; yellow: non-tumor liver parenchyma receiving 30 Gy; green: non-tumor liver parenchyma receiving 15 Gy; blue: spleen; B: T1 weighted contrast-enhanced MRI before RT (left panel, same site as the right panel of (A) and after RT (right panel). The intersect picture of MRI over right panel demonstrates no tumor progression in the RT field on the center section of treatment planning. Arrows indicate tumor margins and arrowhead, recurrent tumor outside the field of RT; C: Time Intensity Curve of ROIs before RT (left panel) and at week 2 of RT (right panel). Red: tumor; yellow: 30 Gy; green: 15 Gy; blue: spleen. The initial spike due to refocusing artifact will not be counted into analysis. (From reference [23], reprint with permission).
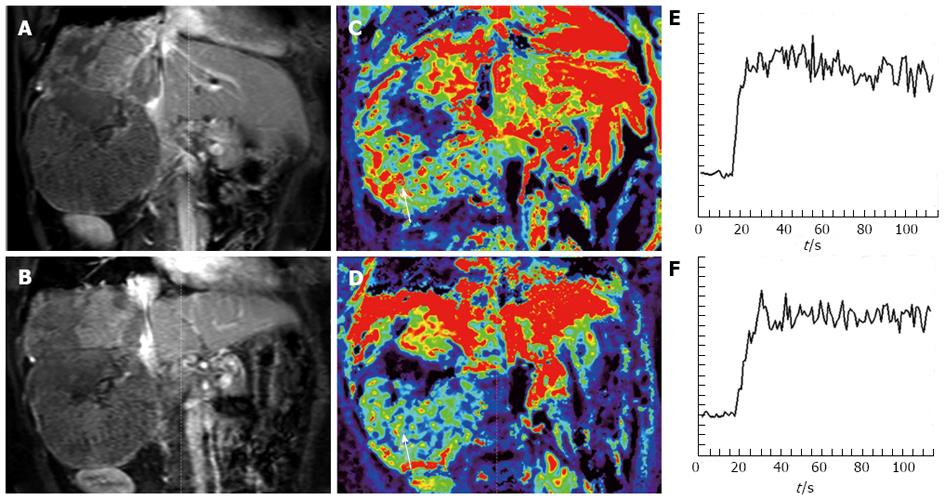
Figure 3 Representative dynamic contrast-enhanced magnetic resonance imaging findings in one advanced hepatocellular carcinoma patient.
A: Post-contrast T1-weighted magnetic resonance imaging at baseline; B: After 14 d of study treatment; C: Corresponding color Ktrans maps at baseline; D: After 14 d of study treatment. Hypervascular area was indicated by red color. The selected region of interest for Ktrans measurement was indicated by white arrows. In this patient, the Ktrans values at baseline and after study treatment were 798.6 × 10⁻³/min and 206.6 × 10⁻³/min, respectively; E: The initial area under the gadolinium concentration-time curves (IAUC) at baseline; F: After study treatment from the same patient. The IAUC values at baseline and after study treatment were 1526.2 mmol/kg × s and 1376.1 mmol/kg × s, respectively. (From reference [58], reprint with permission).
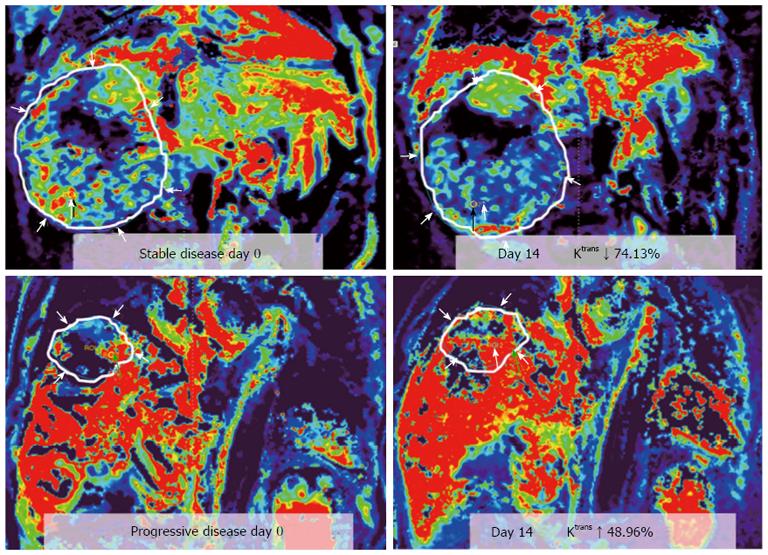
Figure 4 Representative dynamic contrast-enhanced magnetic resonance imaging Ktrans color maps before treatment (day 0, left hand side) and day 14th after treatment (right hand side) in two advanced hepatocellular carcinoma patients.
Corresponding hypervascular area was indicated by red color. region of interests analysis is more sensitive based on hypervascular part than entire tumor, with mean values. Ktrans is a good diagnostic biomarker in differentiation between stable disease (SD, upper row) and progressive disease (PD, lower row) in two patients with hepatocellular carcinoma. Difference of Ktrans (∆Ktrans ) between SD and PD measured on hypervascular part and entire tumor are both significant. (From reference [58], reprint with permission).
- Citation: Chen BB, Shih TTF. DCE-MRI in hepatocellular carcinoma-clinical and therapeutic image biomarker. World J Gastroenterol 2014; 20(12): 3125-3134
- URL: https://www.wjgnet.com/1007-9327/full/v20/i12/3125.htm
- DOI: https://dx.doi.org/10.3748/wjg.v20.i12.3125


