Copyright
©2014 Baishideng Publishing Group Co.
World J Gastroenterol. Mar 21, 2014; 20(11): 2979-2994
Published online Mar 21, 2014. doi: 10.3748/wjg.v20.i11.2979
Published online Mar 21, 2014. doi: 10.3748/wjg.v20.i11.2979
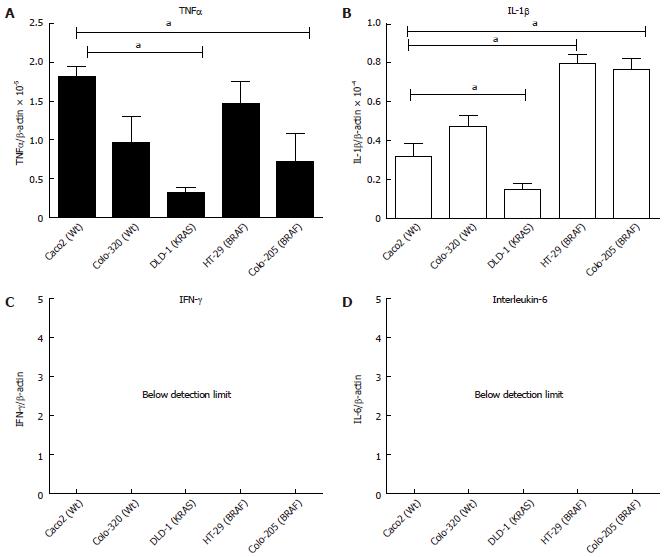
Figure 1 Basal mRNA expression of acute-phase cytokines in different intestinal epithelial cell-lines.
A: Tumor necrosis factor-α (TNF-α); B: Interleukin (IL-β); C: Interferon-γ (IFN-γ); D: Interleukin-6 (IL-6). The mutation is given in parenthesis. 5 × 10⁵ cells were plated into 6 well plates and grown for 24 h. The cells were harvested, total RNA was isolated and first strand cDNA was prepared from 1 μg of total RNA. Ct values were normalized to β-actin as a housekeeping gene. The results were compared with the fold changes of Caco2 mRNA expression, taken as a control. Results represent mean ± SE (aP < 0.05 vs Caco2 analyzed by one way ANOVA, n = 4).
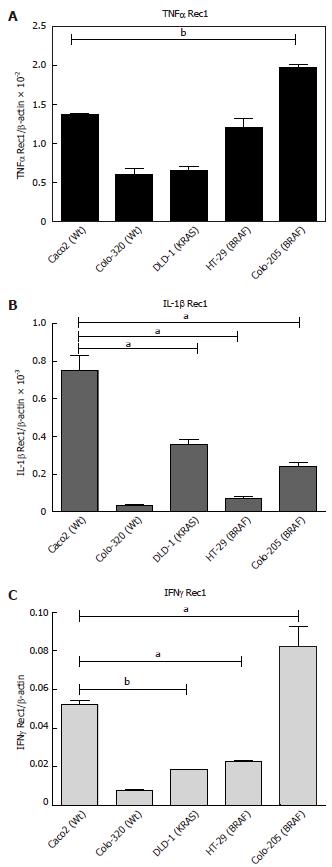
Figure 2 Basal mRNA expression of cytokine receptors in intestinal epithelial cells.
A: Tumor necrosis factor-α (TNFα)- Rec1; B: Interleukin-1β (IL-1β); C: Interferon-γ (IFNγ)-Rec1. 5 × 10⁵ cells were plated into 6 well plates and grown for 24 h. The cells were harvested, total RNA was isolated and first strand cDNA was prepared from 1 μg of total RNA. Ct values were normalized with β-actin as a housekeeping gene. The results were compared with the fold changes of Caco2 mRNA expression, taken as a control. Results represent mean ± SE (aP < 0.05, bP < 0.01 vs Caco2 analyzed by one way ANOVA, n = 4).
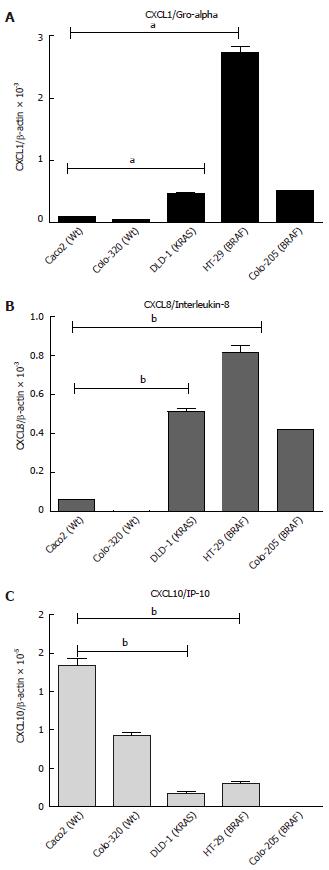
Figure 3 Basal mRNA expression of chemokines in intestinal epithelial cells.
A: CXCL1; B: CXCL8; C: CXCL10. 5 × 10⁵ cells were plated into 6 well plates and grown for 24 h. The cells were harvested, total RNA was isolated and first strand cDNA was prepared from 1 μg of total RNA. Ct values were normalized with β-actin as a housekeeping gene. The results were compared with the fold changes of Caco2 mRNA expression, taken as a control. Results represent mean ± SE (aP < 0.05, bP < 0.01 vs Caco2 analyzed by one way ANOVA, n = 4). CXCL1: Chemokine (C-X-C motif) ligand 1.
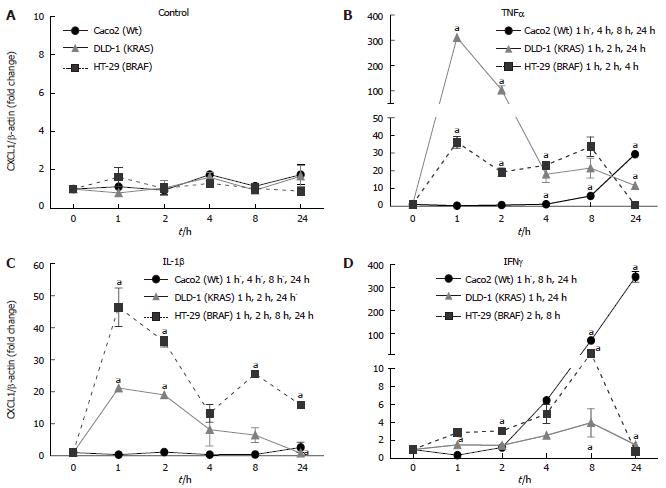
Figure 4 Regulation of CXCL1 mRNA expression by cytokine in intestinal epithelial cells.
A: Relative transcript expression of chemokine (C-X-C motif) ligand (CXCL)1/Gro-alpha in unstimulated cell-lines; B: Relative transcript expression of CXCL1/Gro-alpha in tumor necrosis factor-α (TNFα) stimulated cell-lines; C: Relative transcript expression of CXCL1/Gro-alpha in interleukin (IL)-1beta stimulated cell-lines; D: Relative transcript expression of CXCL1/Gro-alpha in interferon (IFN)-gamma stimulated cell-lines. [5 × 10⁵ cells were plated into 6 well plates and grown for 24 h and then stimulated with tumor necrosis factor α (50 ng), interleukin-1β (1 ng), and interferon-γ (50 ng)]. The cells were harvested, total RNA was isolated and first strand cDNA was prepared from 1 μg of total RNA. Ct values were normalized with β-actin as a housekeeping gene. Results represent mean ± SE (aP < 0.05 vs non-stimulated zero controls) analyzed by one way ANOVA, n = 3).
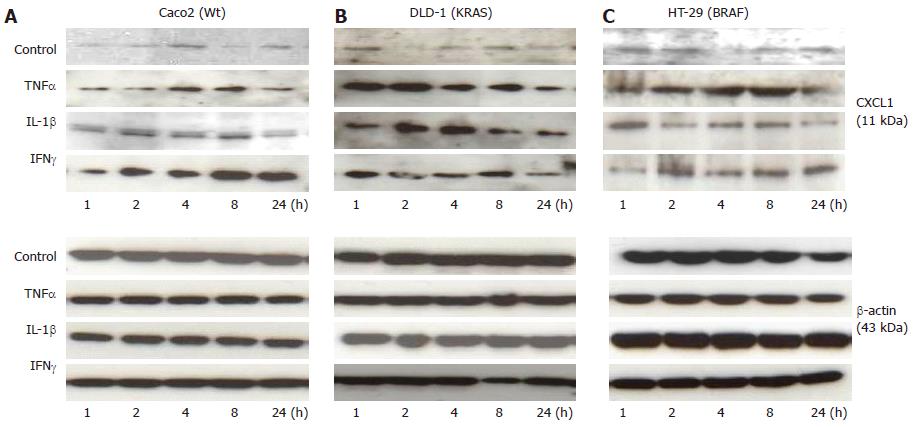
Figure 5 Caco2 (Wt), DLD-1 (KRAS) and HT-29 (BRAF) Western blotting analysis.
The bands represent chemokine (C-X-C motif) ligand (CXCL)-1 protein expression (upper panel) at different time points after stimulation of Caco2 (A), DLD-1 (B) and HT-29 (C) cell lines with tumor necrosis factor-α (TNFα) (50 ng/mL), interleukin (IL)-1beta (1 ng/mL) and interferon (IFN)-gamma (50 ng/mL) compared to the loading control betabb-actin (lower panel).
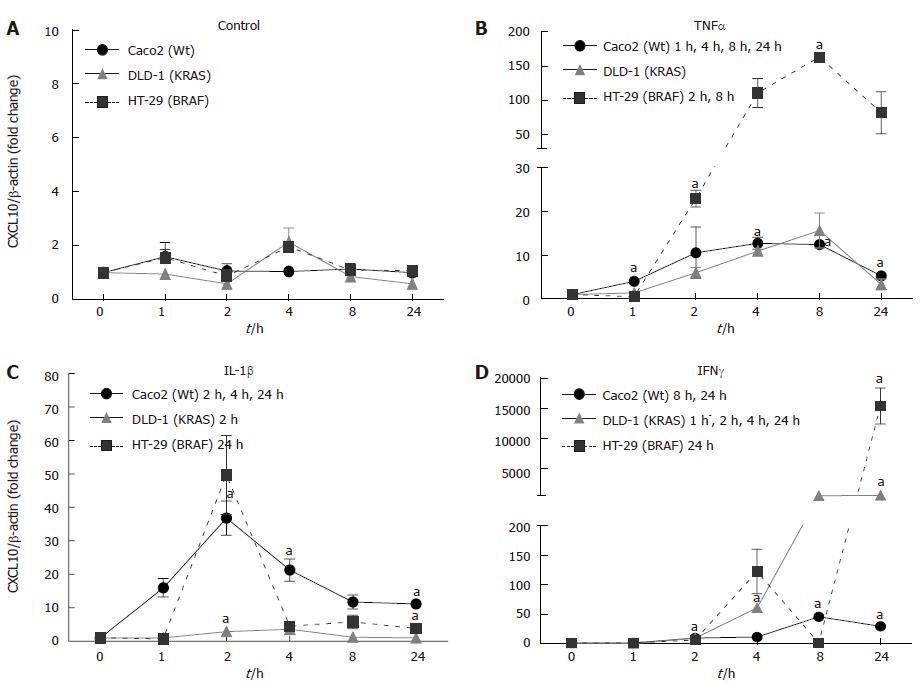
Figure 6 Time Kinetics of chemokine (C-X-C motif) ligand 10 mRNA expression in intestinal epithelial cells.
5 × 10⁵ cells were plated into 6 well plates and grown for 24 h (A) and then stimulated with tumor necrosis factor-α (TNFα) (B, 50 ng), interleukin (IL)-1β (C, 1 ng), and interferon (IFN)-γ (D, 50 ng). The cells were harvested, total RNA was isolated and first strand cDNA was prepared from 1 μg of total RNA. Ct values were normalized with β-actin as a housekeeping gene. Results represent mean ± SE (aP < 0.05 vs non-stimulated zero control) analyzed by one way ANOVA, n = 3). CXCL: Chemokine (C-X-C motif) ligand.
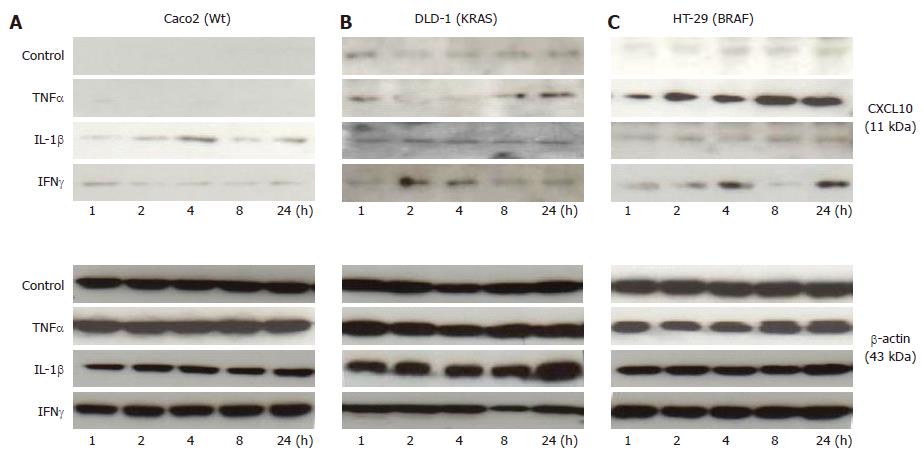
Figure 7 Shows Caco2 (Wt) (A), DLD-1 (KRAS) (B) and HT-29 (BRAF) (C) Western blotting analysis.
The cytokines interleukin-1β (1 ng/mL), tumor necrosis factor α (50 ng/mL) and interferon-γ (50 ng/mL) were stimulated to the cells and the total cell lysates was isolated and 20 μg were separated by 15%-20% NuPAGE Bis-Tris gel electrophoresis, blotted and probed with chemokine (C-X-C motif) ligand (CXCL) 10 antibody. β-actin (43 kDa) was analyzed as an internal control.
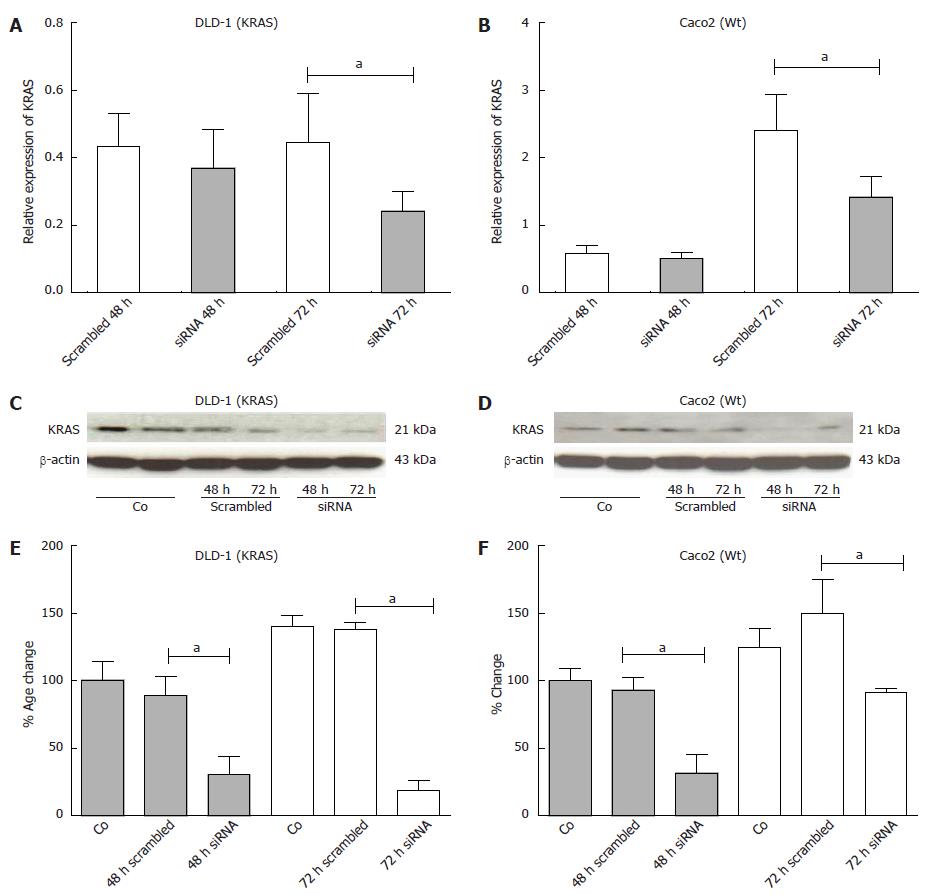
Figure 8 The figure shows the results of KRAS inhibition from transient transfection of KRAS siRNA in DLD-1 and Caco2 cell lines at RNA and protein level.
A-D: Relative expression of KRAS at RNA-level by RT-PCR (A and B) and protein expression by Western blotting (C and D) at 48 h and 72 h after KRAS inhibition; E, F: Note the significant down-regulation of KRAS at 48 and 72 h at protein level by densitometric analysis in both, DLD1 and Caco2 cell-lines. Changes are shown in percent, compared to scrambled siRNA. Data are presented as mean ± SE of 3 independent experiments with double confirmation. aP < 0.05 vs scrambled 72 h.
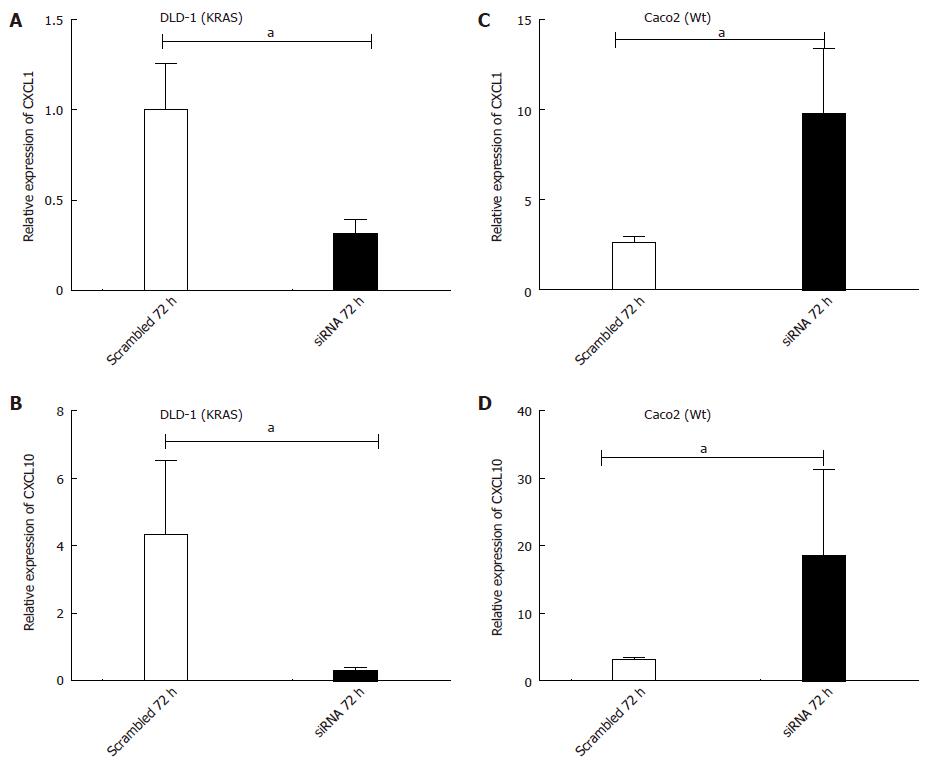
Figure 9 Transient transfection of KRAS siRNA in DLD-1 (KRAS) and Caco2 (Wt) cell line.
Expression of chemokine (C-X-C motif) ligand (CXCL)-1/Gro-alpha (A) and CXCL10/IP-10 (B) in the DLD-1 (KRAS-mutant) cell-line. Expression of CXCL-1/Gro-alpha (C) and CXCL-10/IP-10 (D) in the Caco2 (WT) cell-line. 5 × 10⁴ cells were plated into 24 well plates and grown for 24 h and then transfected with KRAS siRNA or scrambled (20 nmol/L) for 72 h. Real time PCR was performed for chemokine CXCL1 and CXCL10 with gene specific primers and the expression was normalized to β-actin expression measured in the same sample as an internal control. Data presented are the mean ± SE of 4 independent experiments with double confirmation. aP < 0.05 vs scrambled 72 h.
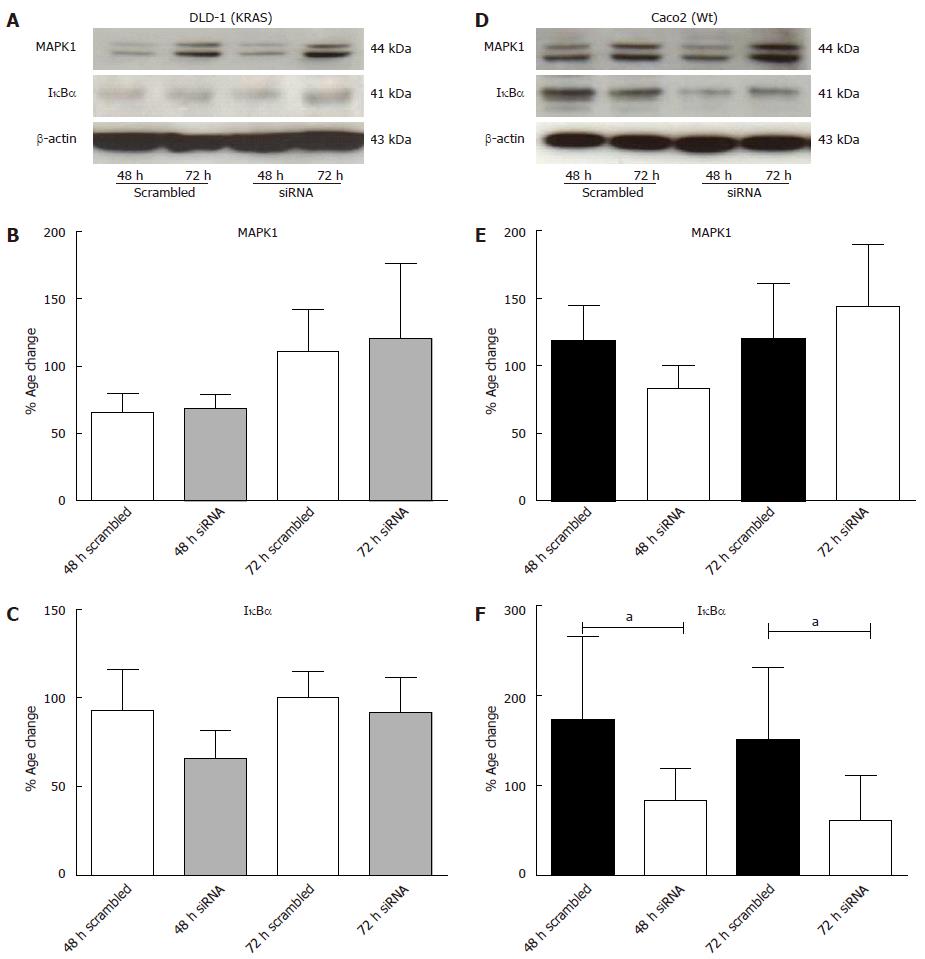
Figure 10 Effect of MAPK1 and IκBα protein expression in DLD-1 and Caco2 cells after KRAS knockdown.
Proteins (20 μg) from whole-cell lysates were size-fractionated by SDS-PAGE and transferred on to membranes, and incubated with antibodies as indicated. Representative Western blotting of mitogen-activated protein kinase (MARK)-1 (44 kDa) and IκBα (41 kDa) proteins in DLD-1 cells (A) and Caco2 cells (D). Densitometric analysis of MAPK-1 (B and C) and IκBα proteins (E and F) in DLD-1 cells and Caco2 cells. Proteins were densitometrically quantified and expressed as percent increase or decrease compared with scrambled controls. Equal loading of total proteins were ensured by β-actin (43 kDa). Data presented are the mean ± SE of 3 independent experiments with double confirmation. aP < 0.05 vs scrambled.
-
Citation: Khan S, Cameron S, Blaschke M, Moriconi F, Naz N, Amanzada A, Ramadori G, Malik IA. Differential gene expression of chemokines in
KRAS andBRAF mutated colorectal cell lines: Role of cytokines. World J Gastroenterol 2014; 20(11): 2979-2994 - URL: https://www.wjgnet.com/1007-9327/full/v20/i11/2979.htm
- DOI: https://dx.doi.org/10.3748/wjg.v20.i11.2979


