Copyright
©2014 Baishideng Publishing Group Co.
World J Gastroenterol. Jan 7, 2014; 20(1): 148-162
Published online Jan 7, 2014. doi: 10.3748/wjg.v20.i1.148
Published online Jan 7, 2014. doi: 10.3748/wjg.v20.i1.148
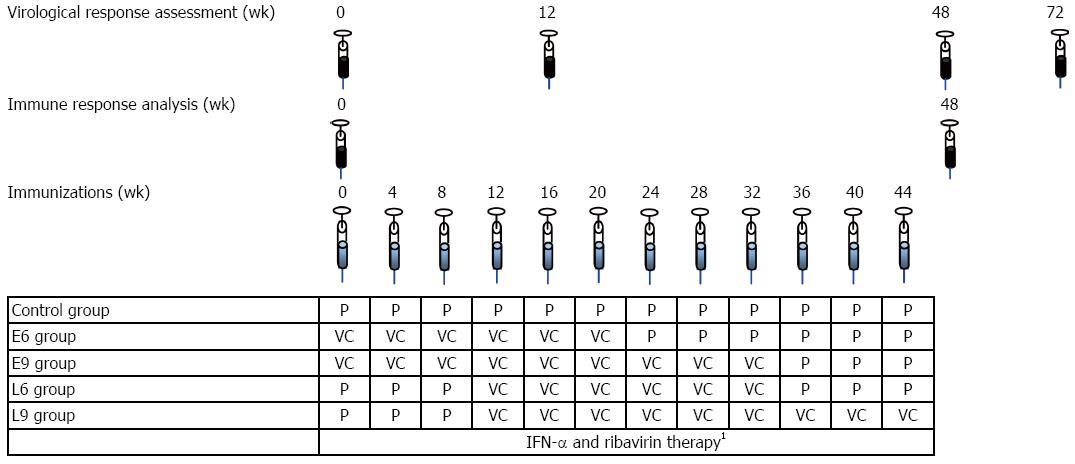
Figure 1 Study design.
148 wk of IFN-α-2b (3 × 10⁶ units, subcutaneous, three times a week) plus ribavirin (1000 or 1200 mg daily, according to body weight)The control group (n = 30) received 12 vaccine placebo inoculations. Two groups received 6 inoculations of CIGB-230, one (n = 16) starting simultaneously with the antiviral treatment as early add-on (E6), and the other (n = 15) starting on week 12 of therapy as late add-on (L6). The remaining two groups were inoculated 9 times with CIGB-230, one (n = 16) as early add-on (E9) and the other (n = 15) as late add-on (L9). All inoculations relating the vaccine candidate or the placebo took place once every 4 wk. To maintain the blinding of the study, placebo administrations took place in the immunization groups, once every 4 wk, on weeks not corresponding to vaccine candidate administration, according to the immunization schedule. IFN: Interferon; VC: Vaccine candidate; P: Vaccine candidate’s placebo.
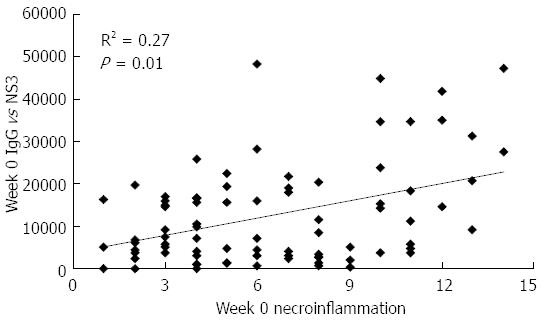
Figure 2 Baseline correlation between total IgG titer against NS3 and necroinflammation in patients of the study.
Data refer to all the patients included in the study. Antibody titers are given in arbitrary units, necroinflammation was evaluated by liver biopsy according to the Ishak score[17]. Statistically significant differences were considered when P < 0.05 (Spearman’s rank correlation).
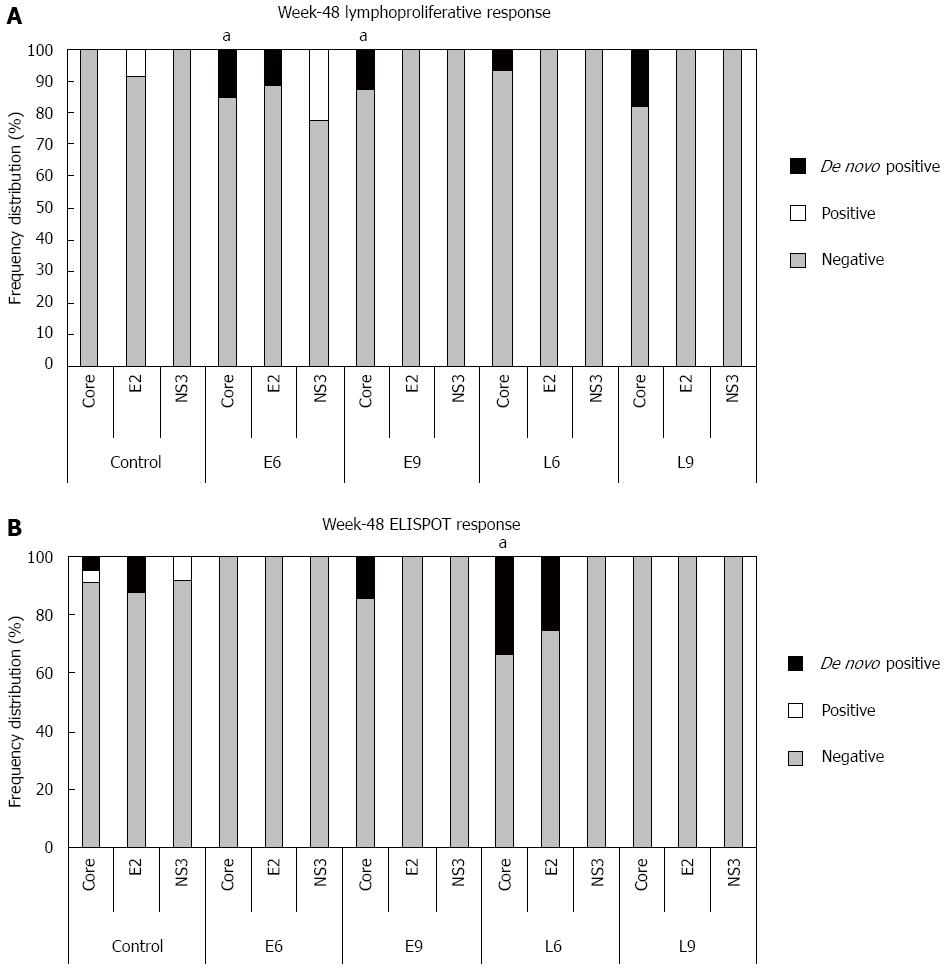
Figure 3 Frequency of hepatitis C virus-specific cell-mediated immune responses induced by CIGB-230 in combination with interferon-α plus ribavirin on week 48.
A: Frequency of lymphoproliferative responses against hepatitis C virus (HCV) antigens. aDenotes a statistically significant difference between the CIGB-230 early add-on groups (E6 + E9) and the control group regarding the frequency of de novo core-specific responses (P = 0.04); B: Frequency of interferon-γ secretion responses against HCV antigens. aDenotes a statistically significant difference between L6 group and the control group with respect to the frequency of de novo core specific responses (P = 0.03). Significant differences were considered for P < 0.05; Fisher’s exact test. In the Figure “De novo positive” refers to responses that were undetectable on week 0 and became detectable on week 48; “Positive” refers to detectable responses on week 48 that were also detectable on week 0, and “Negative” refers to undetectable responses on week 48.
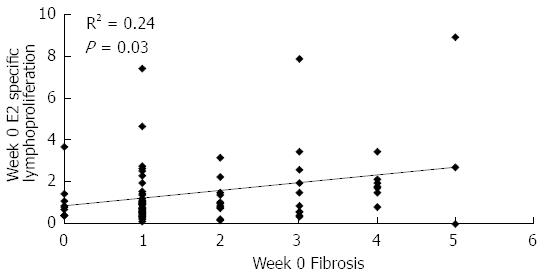
Figure 4 Baseline correlation between E2-specific lymphoproliferation and fibrosis in patients of the study.
Data refer to all patients included in the study. E2-specific lymphoproliferation is given as stimulation index, fibrosis was evaluated by liver biopsy according to the Ishak score[17]. Statistically significant differences were considered when P < 0.05 (Spearman’s rank correlation).
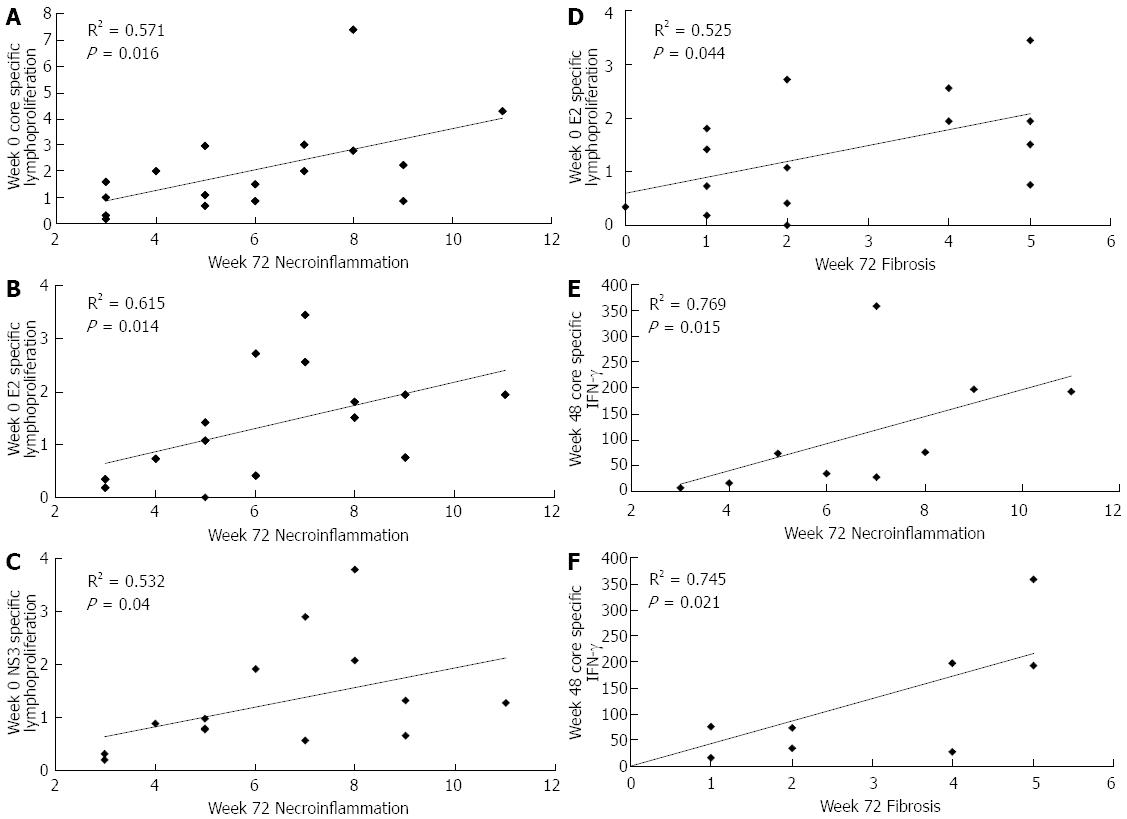
Figure 5 Correlations between hepatitis C virus-specific cell-mediated immune responses and histological parameters in patients of the study.
Data refer to CIGB-230 immunized patients who were not able to clear viral RNA after treatment (virological non-responders). Lymphoproliferation is given as stimulation index; interferon-γ (IFN-γ) secretion is given as spot forming cells/106 cells; histological parameters were evaluated by liver biopsy according to the Ishak score[17]. Statistically significant differences were considered when P < 0.05 (Spearman’s rank correlation).
- Citation: Amador-Cañizares Y, Martínez-Donato G, Álvarez-Lajonchere L, Vasallo C, Dausá M, Aguilar-Noriega D, Valenzuela C, Raíces I, Dubuisson J, Wychowski C, Cinza-Estévez Z, Castellanos M, Núñez M, Armas A, González Y, Revé I, Guerra I, Pérez Aguiar &, Dueñas-Carrera S. HCV-specific immune responses induced by CIGB-230 in combination with IFN-α plus ribavirin. World J Gastroenterol 2014; 20(1): 148-162
- URL: https://www.wjgnet.com/1007-9327/full/v20/i1/148.htm
- DOI: https://dx.doi.org/10.3748/wjg.v20.i1.148


