Copyright
©The Author(s) 1996.
World J Gastroenterol. Sep 15, 1996; 2(3): 167-170
Published online Sep 15, 1996. doi: 10.3748/wjg.v2.i3.167
Published online Sep 15, 1996. doi: 10.3748/wjg.v2.i3.167
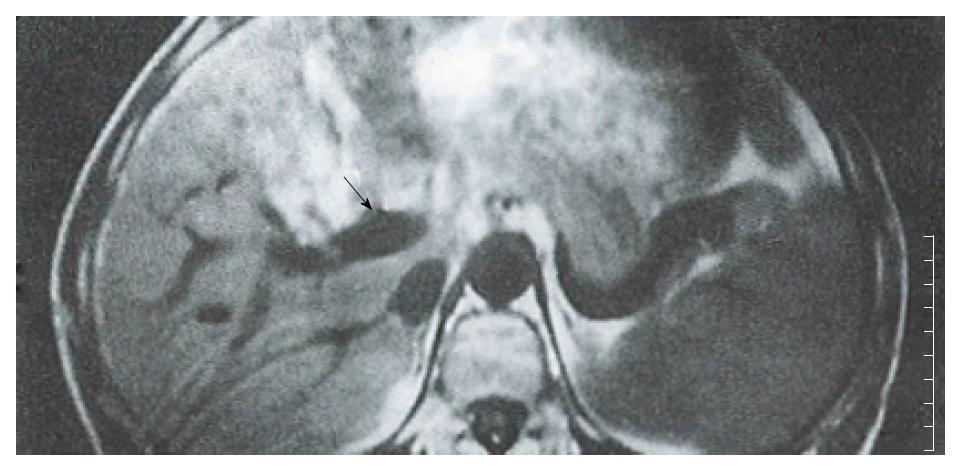
Figure 1 Patient with HCC.
T1 weighed (500/15) MR images of the upper abdomen showed the portal tumor thrombus as a clot of iso-signal intensity (arrow).
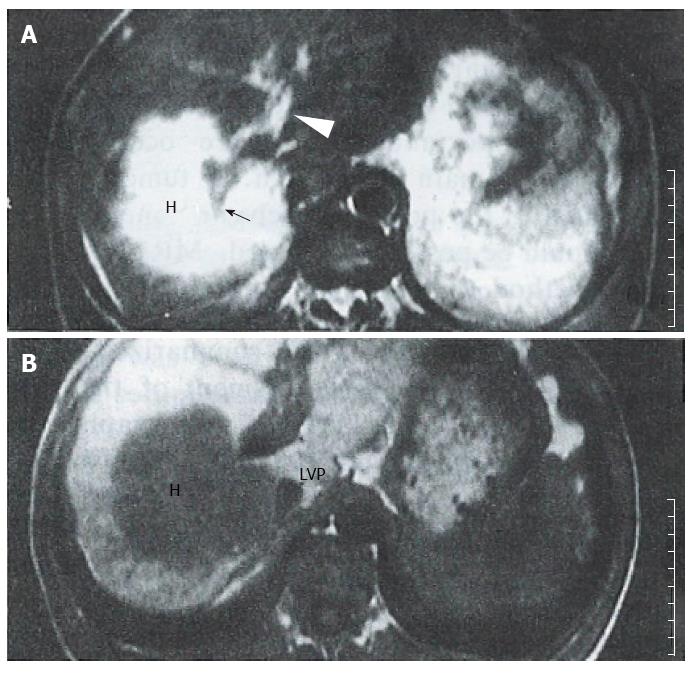
Figure 2 Patient with HCC enclosing the right branch.
A: T2 weighed (2000/80) images showed the tumor (H) having a higher signal intensity than the parenchyma. The right branch of the portal vein in the tumor ended abruptly, and appeared as a stump (arrow). Some irregular hyperintensity was seen in the dilated main and left portal vein (arrowhead). B: FLASH (100/6) imaging showed main and left portal vein dilation with heterogeneous intensity more clearly than did SE imaging. The IVP was compressed by the tumor.
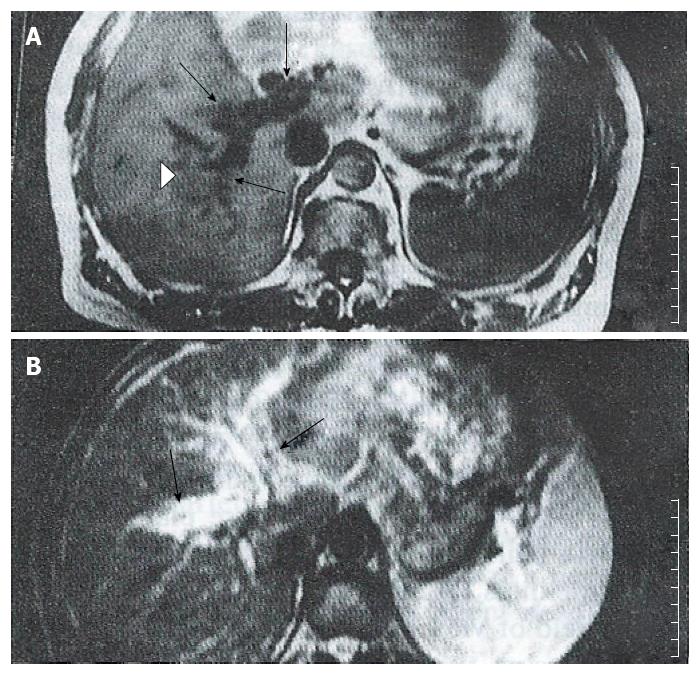
Figure 3 Patient with HCC.
A: T1 weighed (500/15) images showed diffuse, irregular narrow right branches with numerous nodules (arrow); the distal portal vein was poorly delineated (arrowhead). Several small flowing voids representing collateral vessels were seen. B: T2 weighed (2000/80) MR images showed the left portal venous wall as slightly hyperintense, indicating invasion by the tumor (arrow)
- Citation: Zhu XX, Chen JK, Lu GM. Magnetic resonance imaging of portal vein invasion in hepatocellular carcinoma: Results from 25 cases. World J Gastroenterol 1996; 2(3): 167-170
- URL: https://www.wjgnet.com/1007-9327/full/v2/i3/167.htm
- DOI: https://dx.doi.org/10.3748/wjg.v2.i3.167


