Copyright
©2013 Baishideng Publishing Group Co.
World J Gastroenterol. Mar 7, 2013; 19(9): 1387-1395
Published online Mar 7, 2013. doi: 10.3748/wjg.v19.i9.1387
Published online Mar 7, 2013. doi: 10.3748/wjg.v19.i9.1387
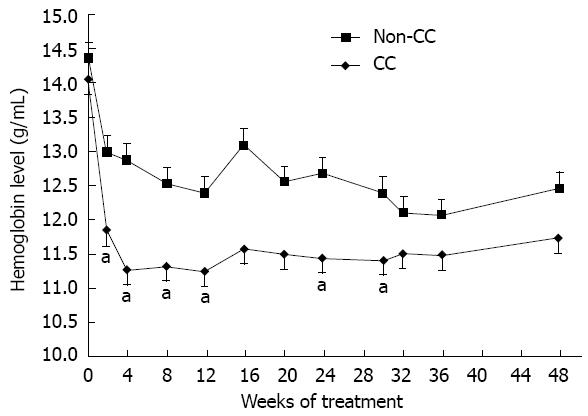
Figure 1 The hemoglobin decline in CC and non-CC inosine triphosphate pyrophosphatase genotypes.
The hemoglobin (Hb) levels of the CC group show greater decline than those of the non-CC treatment groups during the course of treatment, with significance at weeks 2, 4, 8, 12, 24 and 30. aP < 0.05 vs non-CC. The error bars indicate SE of the mean Hb level.
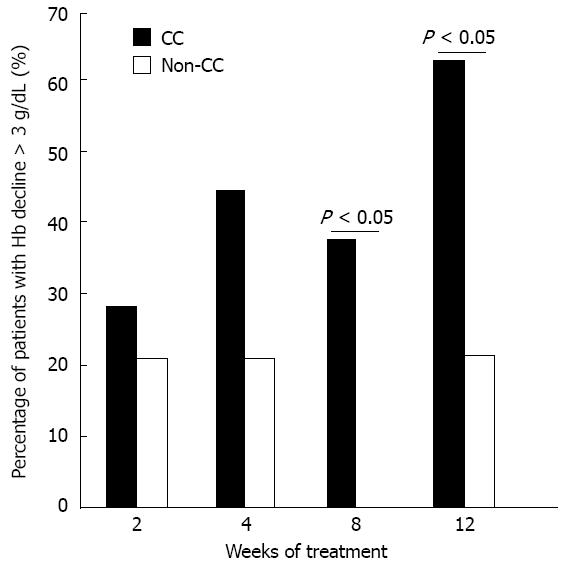
Figure 2 Patients with hemoglobin decline more than 3 g/dL.
The percentage of CC and non-CC group patients who had hemoglobin (Hb) decline of more than 3 g/dL during the first 12 wk.
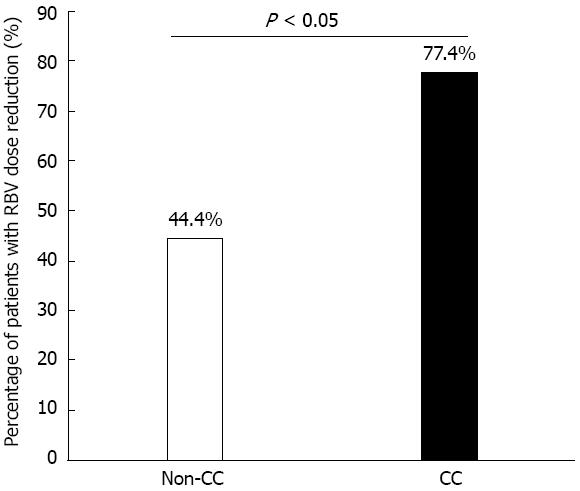
Figure 3 Patients with ribavirin dose reduction.
Percentage of patients who had ribavirin (RBV) dose reduction during the first 12 wk of the combination treatment: It was significantly higher in the CC than in the non-CC genotype groups.
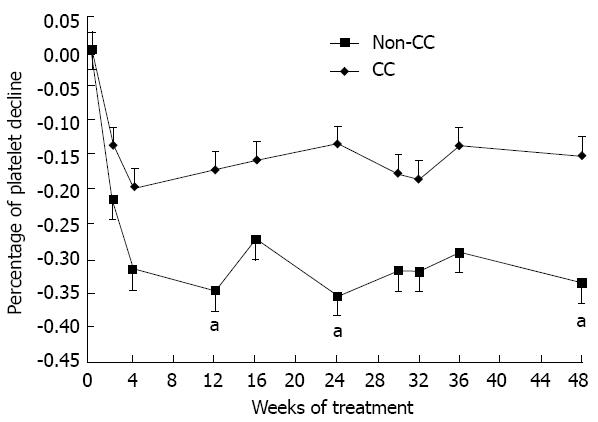
Figure 4 Decline of platelets of patients with different inosine triphosphate pyrophosphatase genotypes.
The percentages of platelet decline of CC and non-CC group patients throughout the 48 wk of combination treatment. It indicates a greater decline of platelet count in the non-CC than CC variants. aP < 0.05 at weeks 12, 24 and 48. Error bars indicate standard error.
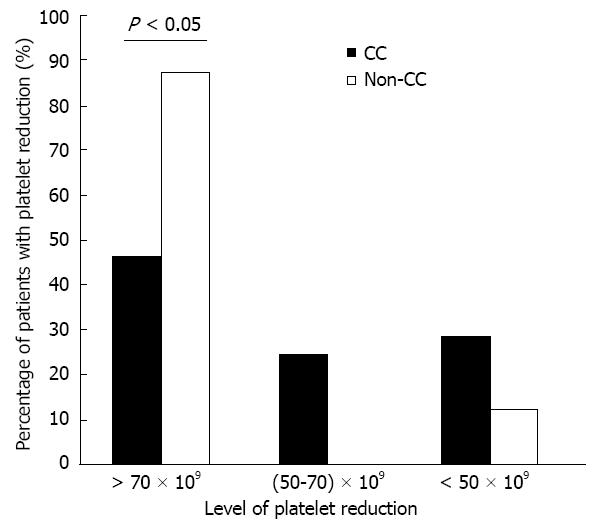
Figure 5 Patients with 3 different levels of platelet decline.
The percentages of patients according to 3 different levels of platelet decline at week 4 of combination treatment in both groups of inosine triphosphate pyrophosphatase genotypes. Statistical significance is shown with greater level of platelet decline.
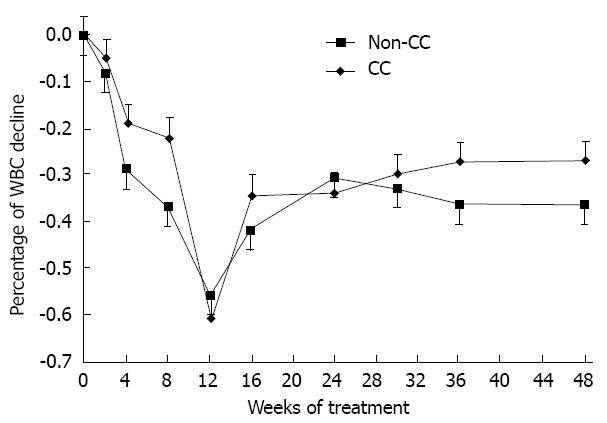
Figure 6 White blood cell decline of both inosine triphosphate pyrophosphatase genotypes.
The change in white blood cells (WBCs) in the CC and non-CC inosine triphosphate pyrophosphatase genotype groups during the 48 wk of combination treatment: No significant difference between the 2 groups was found. Error bars indicate standard error.
- Citation: Ahmed WH, Furusyo N, Zaky S, Sharaf Eldin A, Aboalam H, Ogawa E, Murata M, Hayashi J. Pre-treatment role of inosine triphosphate pyrophosphatase polymorphism for predicting anemia in Egyptian hepatitis C virus patients. World J Gastroenterol 2013; 19(9): 1387-1395
- URL: https://www.wjgnet.com/1007-9327/full/v19/i9/1387.htm
- DOI: https://dx.doi.org/10.3748/wjg.v19.i9.1387


