Copyright
©2013 Baishideng Publishing Group Co.
World J Gastroenterol. Dec 28, 2013; 19(48): 9334-9342
Published online Dec 28, 2013. doi: 10.3748/wjg.v19.i48.9334
Published online Dec 28, 2013. doi: 10.3748/wjg.v19.i48.9334
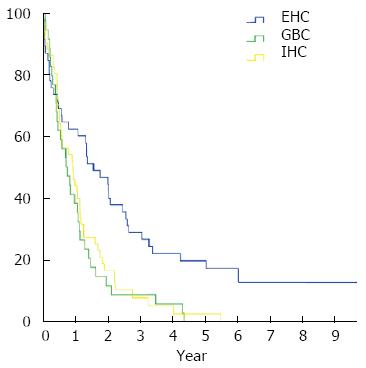
Figure 1 Survival of patients with biliary tract cancer by primary tumor localization.
Kaplan-Meier estimates of overall survival in patients with extrahepatic biliary tract cancer (BTC) (n = 45, blue line), intrahepatic BTC (n = 50, yellow line), and gall bladder cancer (n = 34, green line).
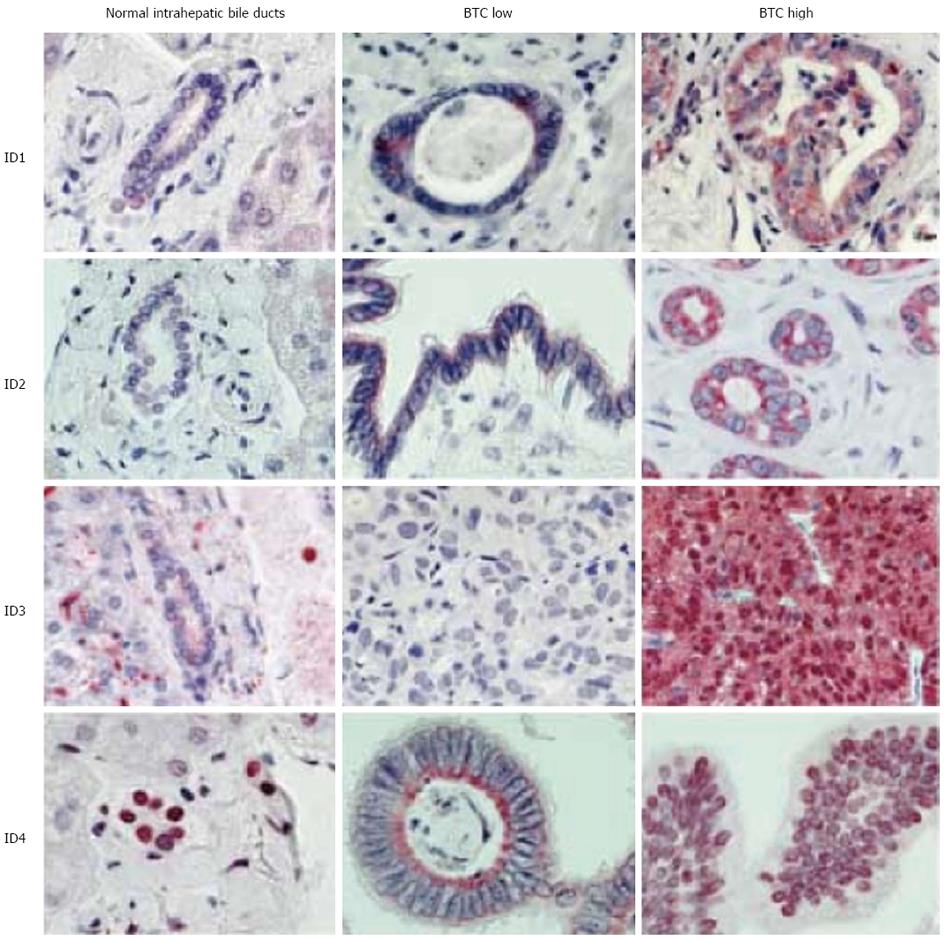
Figure 2 Inhibitor of differentiation protein expression in normal intrahepatic bile ducts and biliary tract cancer.
Representative photographs. Depicted are representative stains of normal intrahepatic bile ducts, low and high expressing biliary tract cancer cases for each inhibitor of differentiation (ID) protein.
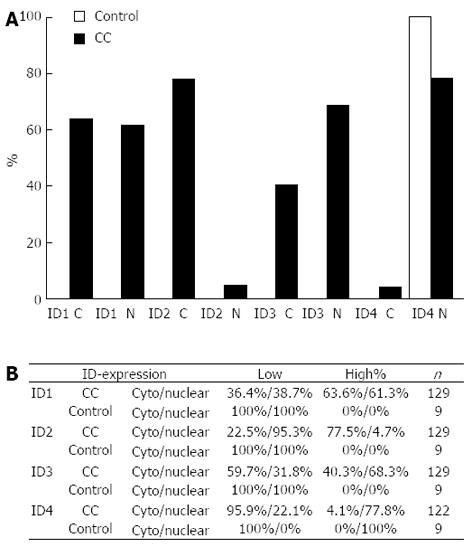
Figure 3 Proportion of inhibitor of differentiation protein expression in biliary tract cancer and normal intrahepatic bile ducts.
A: Percentage of biliary tract cancer (BTC) with high expression of the respective inhibitor of differentiation (ID) protein in BTC (black bars) and normal intrahepatic bile ducts (control; grey bar); B: Summary of ID protein expression. Overall ID protein expression ID protein expression was scored in low (0+1) and high (2+3) and assessed for nuclear and cytoplasmic (cyto) staining pattern. Cytoplasmic staining intensity was scored 0 (negative) to 3 (strong), nuclear expression was scored based on the percentage of positive nuclei (0: 0%-10%; 1: 11%-50%; 2: 51%-80%; and 3: 81%-100%). For ID4, only 122 samples could be analyzed. C: Cytoplasmic expression; N: Nuclear expression.
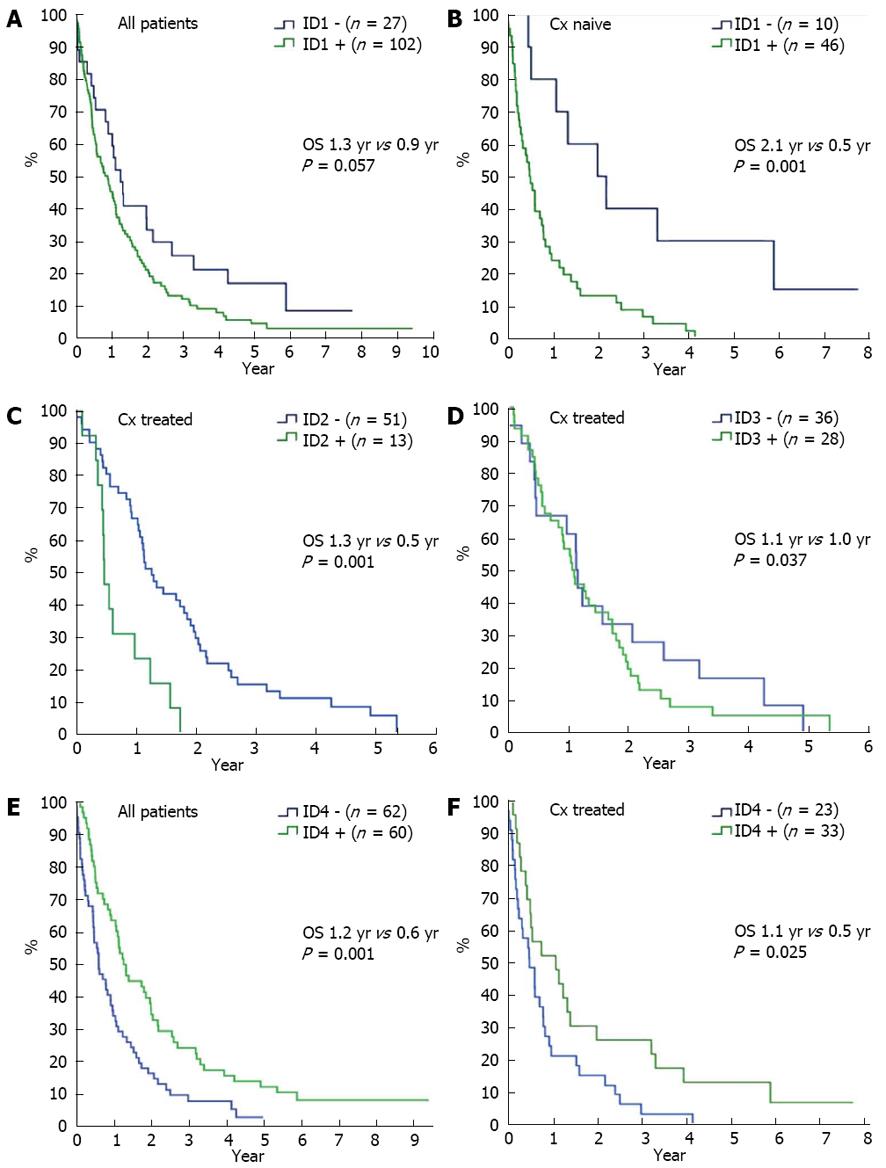
Figure 4 Kaplan-Meier survival estimates for overall survival from time of diagnosis for patients with biliary tract cancer expressing ID1-ID4 with or without systemic chemotherapy.
A: Survival in patients (n = 129) with (green line) and without nuclear ID1 expression (blue line); B: Survival in patients who have not received systemic chemotherapy (n = 56) with (green line) or without nuclear ID1 expression (blue line); C: Survival in patients who have received systemic chemotherapy (n = 64) with (green line) or without nuclear ID2 expression (blue line); D: Survival in patients who have not received systemic chemotherapy (n = 64) with (green line) or without cytoplasmic ID3 expression (blue line); E: Survival in patients (n = 122) with (green line) and without cytoplasmic ID4 expression (blue line); F: Survival in patients who have not received systemic chemotherapy (n = 56) with (green line) or without cytoplasmic ID4 expression (blue line). Cx: Chemotherapy.
- Citation: Harder J, Müller MJ, Fuchs M, Gumpp V, Schmitt-Graeff A, Fischer R, Frank M, Opitz O, Hasskarl J. Inhibitor of differentiation proteins do not influence prognosis of biliary tract cancer. World J Gastroenterol 2013; 19(48): 9334-9342
- URL: https://www.wjgnet.com/1007-9327/full/v19/i48/9334.htm
- DOI: https://dx.doi.org/10.3748/wjg.v19.i48.9334


