Copyright
©2013 Baishideng Publishing Group Co.
World J Gastroenterol. Dec 14, 2013; 19(46): 8659-8670
Published online Dec 14, 2013. doi: 10.3748/wjg.v19.i46.8659
Published online Dec 14, 2013. doi: 10.3748/wjg.v19.i46.8659
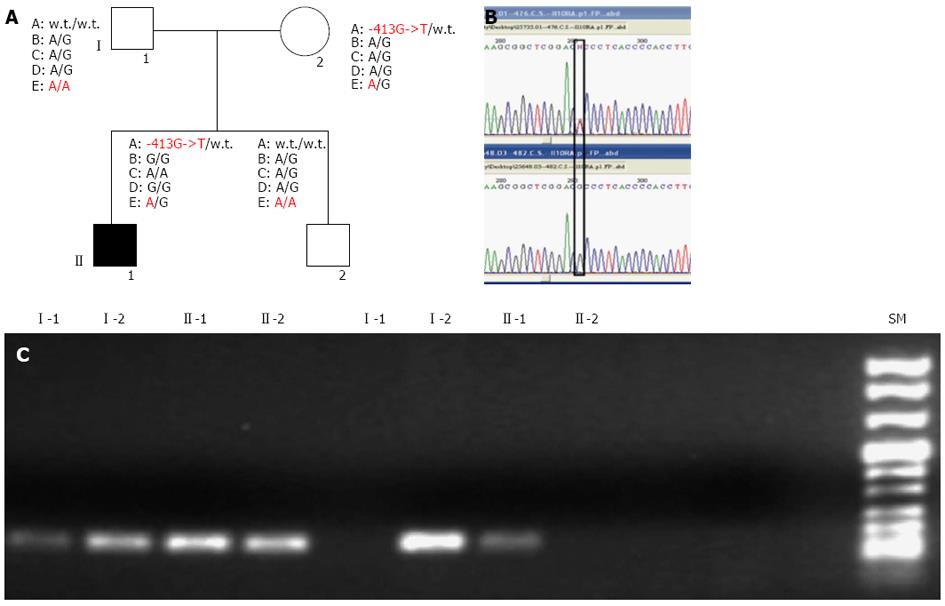
Figure 1 Molecular characterisation of variant alleles within interleukin-10 receptor genes in the inflammatory bowel diseases family members.
A: Pedigree of the inflammatory bowel diseases (IBD) family and genomic single-nucleotide polymorphisms identified: interleukin-10 (IL10) RA: - 413G->T (A); IL10RA-rs.: 2256111 Esone 4 c.549A->G (p.153Ala->Ala) (B); IL10RA-rs.:2229113 Esone 7 c.1051A->G (p.351Arg->Gly) (C); IL10RA-rs.:9610 3’UTR c.2543G->A (D); IL10RB-rs.: 2834167 Esone 1 c.139G->A (p.47 Lys ->Glu) (E); B: Sequence analysis of IL10RA promoter region. Sequence analysis was performed on amplified fragments from gDNA of the patients. Reported here are the electropherogram around the identified mutation - 413G->T. The specific mutated nucleotide is shown within the black box; C: Gel-electrophoresis of the amplification refractory mutation-polymerase chain reaction performed for the - 413G->T IL10RA promoter mutations. Patient numbering corresponds to that adopted in the shown above pedigree.
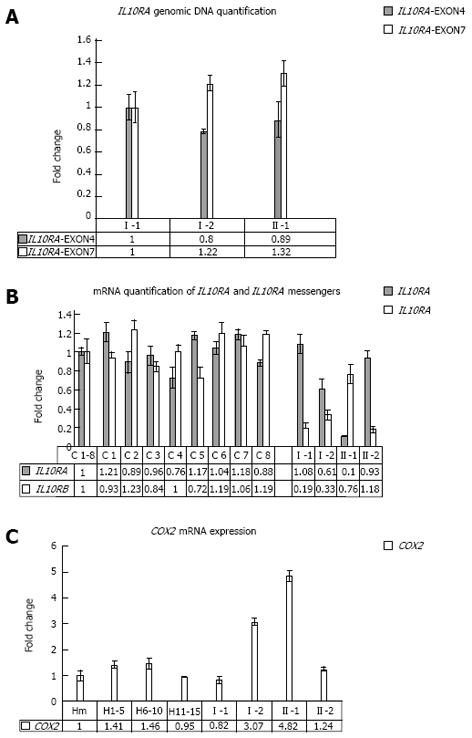
Figure 2 Real time polymerase chain reaction analysis of interleukin-10 receptors and COX2 performed on peripheral blood cells.
A: Copy number quantification of interleukin-10 (IL10) gene. Real time polymerase chain reaction (PCR) quantification analysis was performed for IL10RA. IL10RA-exon4: Amplified fragment at the boundaries of exon 4 and IVS4 of the gene; IL10RA-exon7: Amplified fragment at the boundaries of exon 7 and IVS7 of the gene; Patient numbering corresponds to that adopted in the pedigree shown in Figure 1A. B: Real time PCR quantification analysis of IL10RA and IL10RB mRNA. Real time RT-PCR quantification analysis was performed for IL10RA and IL10RB mRNA. C1-8: Mean value between all healthy samples used as calibrator to measure the relative expression; C1 to C8: Healthy subjects. Patient numbering corresponds to that adopted in the pedigree shown in Figure 1A. C: Real Time PCR quantification analysis of COX2 messenger. H1-5, H6-10, H11-15: Mixes of healthy subjects; Hm: Mean value between all healthy samples used as calibrator to measure the relative expression; Patient numbering corresponds to that adopted in the pedigree shown in Figure 1A.
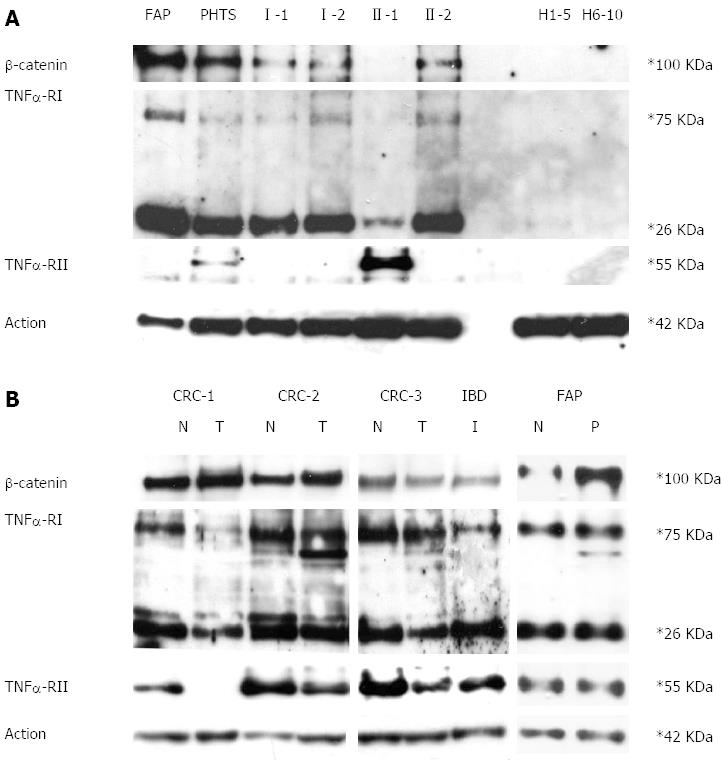
Figure 3 β-catenin, tumour necrosis factor α receptors-I and II protein expression performed on peripheral blood cells and colon mucosa.
A: Western blotting assay of β-catenin tumour necrosis factor α receptors-I (TNFRI) and TNFRII performed on protein extracts from peripheral blood cells. Familial adenomatous polyposis (FAP): Patient affected by adenomatous polyposis coli; PHTS: Patient affected by PTEN hamartoma tumour syndrome; I-1, I-2, II-1, II-2: Patient numbering corresponds to that adopted in the pedigree shown in Figure 1A. H1-5, H6-10: mixes of healthy subjects; B: Western blotting assay of β-catenin TNFRI and TNFRII performed on protein extracts from colon mucosa. FAP: Patient affected by adenomatous polyposis coli; colorectal cancer (CRC)1, CRC2, CRC3: Patients affected by sporadic colorectal mucosa; inflammatory bowel diseases (IBD): Affected proband; N: Healthy colon mucosa; T: Colon tumour; P: Colon polyp; I: Inflamed colon mucosa.
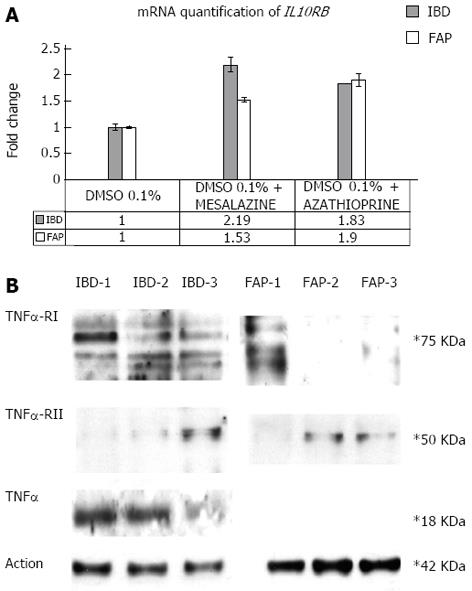
Figure 4 Effects of mesalazine and azathioprine on inflammatory bowel diseases and familial adenomatous polyposis primary fibroblasts.
A: Real time polymerase chain reaction (PCR) quantification analysis of interleukin-10 (IL10) mRNA; Real time RT-PCR quantification analysis was performed for IL10RB mRNA on primary fibroblasts extracted from an inflammatory bowel diseases (IBD) and a familial adenomatous polyposis (FAP) patient and incubated with mesalazine and azathioprine; B: Western blotting assay of tumour necrosis factor α receptors-I (TNFRI) and TNFRII and tumour necrosis factor α (TNFα) performed on protein extracts from primary fibroblasts of an IBD and of a FAP patient. IBD-1: Protein extract of the IBD proband primary fibroblasts incubated with 0.1% DMSO only; IBD-2: Protein extract of the IBD proband primary fibroblasts incubated with 0.1% DMSO and mesalazine; IBD-3: Protein extract of the IBD proband primary fibroblasts incubated with 0.1% DMSO and azathioprine; FAP-1: Protein extract of the FAP patient’s primary fibroblasts incubated with 0.1% DMSO only; FAP-2: Protein extract of the FAP patient’s primary fibroblasts incubated with 0.1% DMSO and mesalazine; FAP-3: Protein extract of the FAP patient’s primary fibroblasts incubated with 0.1% DMSO and azathioprine.
- Citation: Galatola M, Miele E, Strisciuglio C, Paparo L, Rega D, Delrio P, Duraturo F, Martinelli M, Rossi GB, Staiano A, Izzo P, Rosa MD. Synergistic effect of interleukin-10-receptor variants in a case of early-onset ulcerative colitis. World J Gastroenterol 2013; 19(46): 8659-8670
- URL: https://www.wjgnet.com/1007-9327/full/v19/i46/8659.htm
- DOI: https://dx.doi.org/10.3748/wjg.v19.i46.8659


