Copyright
©2013 Baishideng Publishing Group Co.
World J Gastroenterol. Dec 7, 2013; 19(45): 8427-8434
Published online Dec 7, 2013. doi: 10.3748/wjg.v19.i45.8427
Published online Dec 7, 2013. doi: 10.3748/wjg.v19.i45.8427
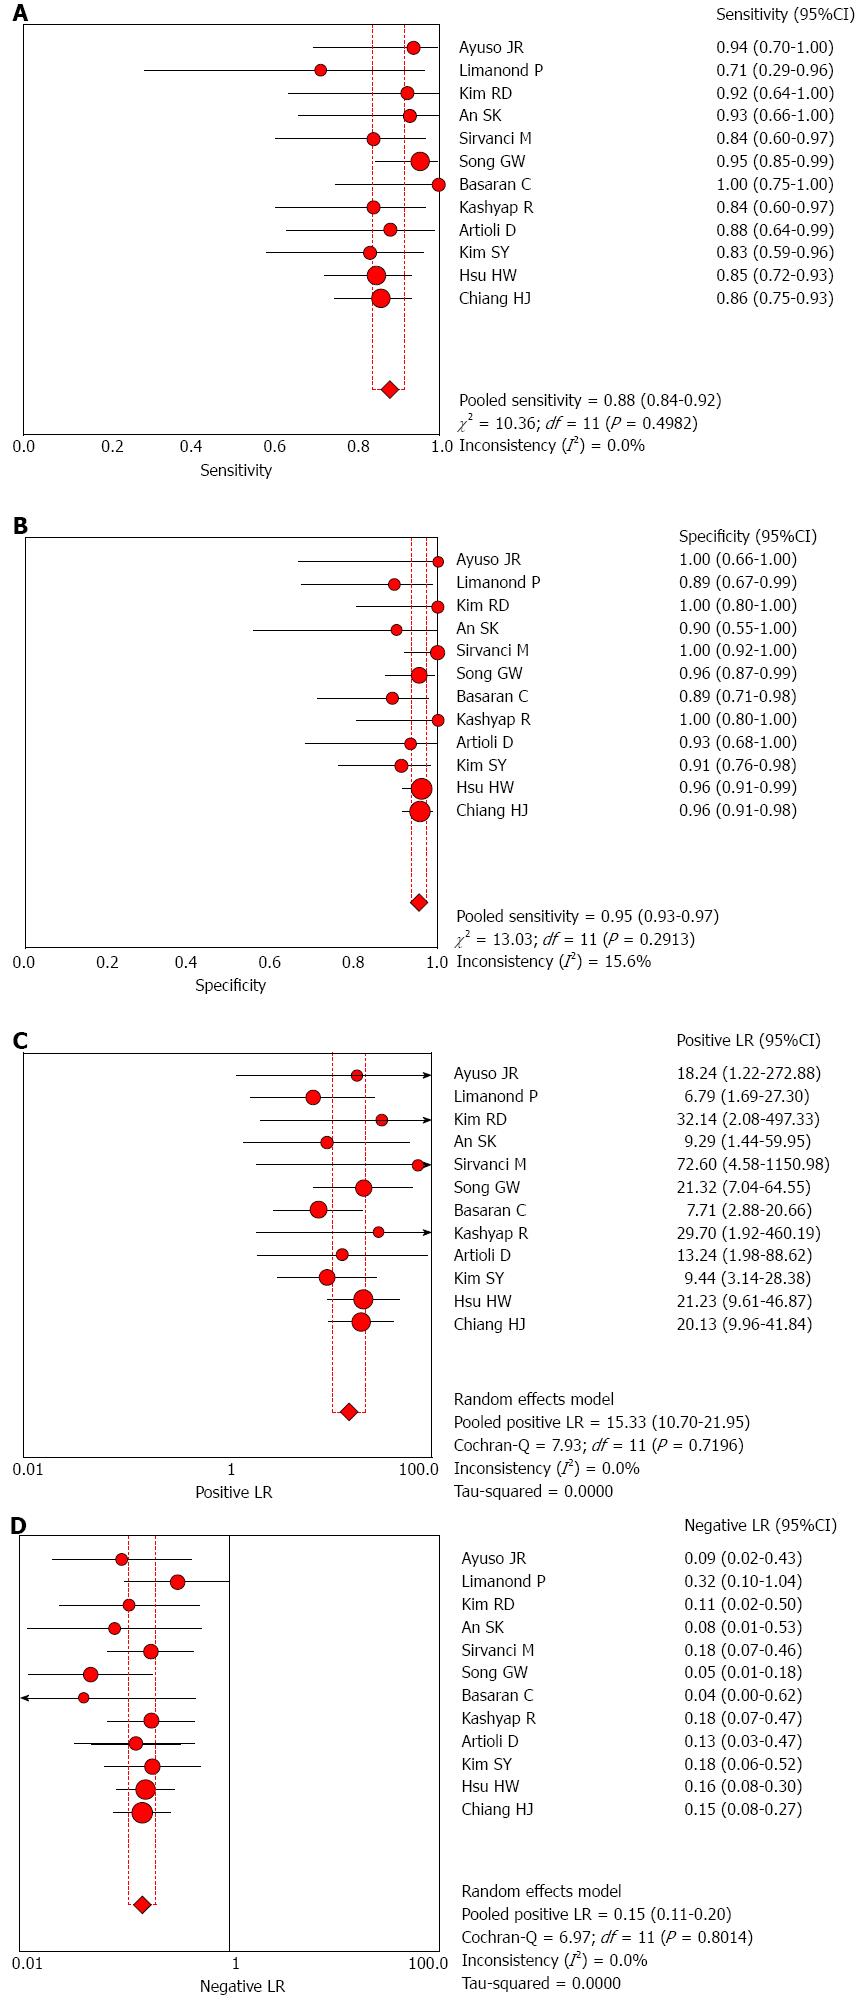
Figure 1 Forest plot of summary results of magnetic resonance cholangiography in the diagnosis of biliary anatomy in living-donor liver transplantation.
A: Sensitivity; B: Specificity; C: Positive likelihood ratio; D: Negative likelihood ratio.
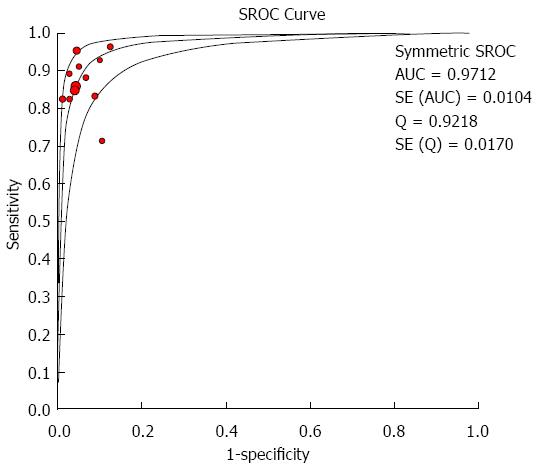
Figure 2 Summary receiver-operating characteristic curve of biliary anatomy in living-donor liver transplantation.
SROC: Summary receiver-operating characteristic curve; AUC: Area under the curve.
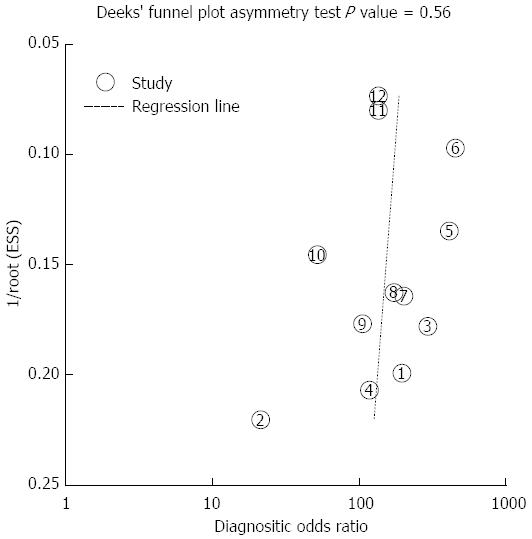
Figure 3 Deek’s funnel plot asymmetry test for identifying publication bias in the diagnosis of biliary anatomy in living-donor liver transplantation.
- Citation: Xu YB, Bai YL, Min ZG, Qin SY. Magnetic resonance cholangiography in assessing biliary anatomy in living donors: A meta-analysis. World J Gastroenterol 2013; 19(45): 8427-8434
- URL: https://www.wjgnet.com/1007-9327/full/v19/i45/8427.htm
- DOI: https://dx.doi.org/10.3748/wjg.v19.i45.8427


