Copyright
©2013 Baishideng Publishing Group Co.
World J Gastroenterol. Dec 7, 2013; 19(45): 8420-8426
Published online Dec 7, 2013. doi: 10.3748/wjg.v19.i45.8420
Published online Dec 7, 2013. doi: 10.3748/wjg.v19.i45.8420
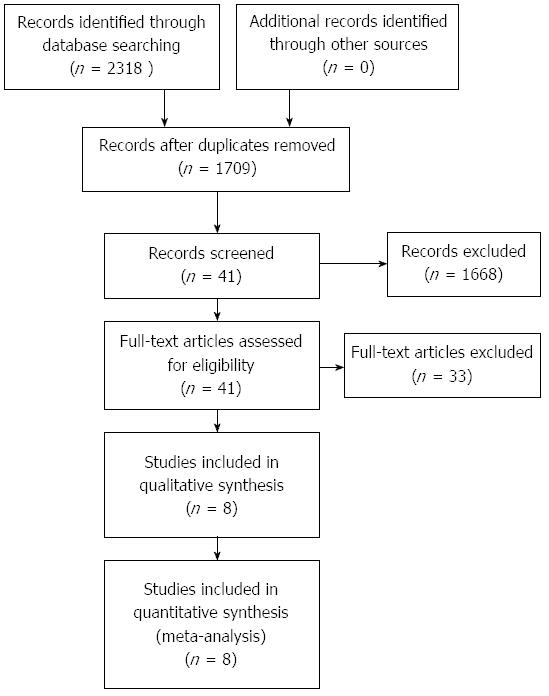
Figure 1 Flow diagram of the study selection process.
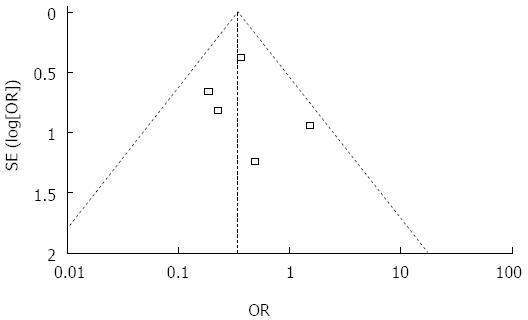
Figure 2 Funnel plot of studies included in the meta-analysis of bile leakage test group vs non-bile leakage test group.
Figure 3 Bile Leakage between bile leakage test group vs non-bile leakage test group.
- Citation: Wang HQ, Yang J, Yang JY, Yan LN. Bile leakage test in liver resection: A systematic review and meta-analysis. World J Gastroenterol 2013; 19(45): 8420-8426
- URL: https://www.wjgnet.com/1007-9327/full/v19/i45/8420.htm
- DOI: https://dx.doi.org/10.3748/wjg.v19.i45.8420


