Copyright
©2013 Baishideng Publishing Group Co.
World J Gastroenterol. Dec 7, 2013; 19(45): 8282-8291
Published online Dec 7, 2013. doi: 10.3748/wjg.v19.i45.8282
Published online Dec 7, 2013. doi: 10.3748/wjg.v19.i45.8282
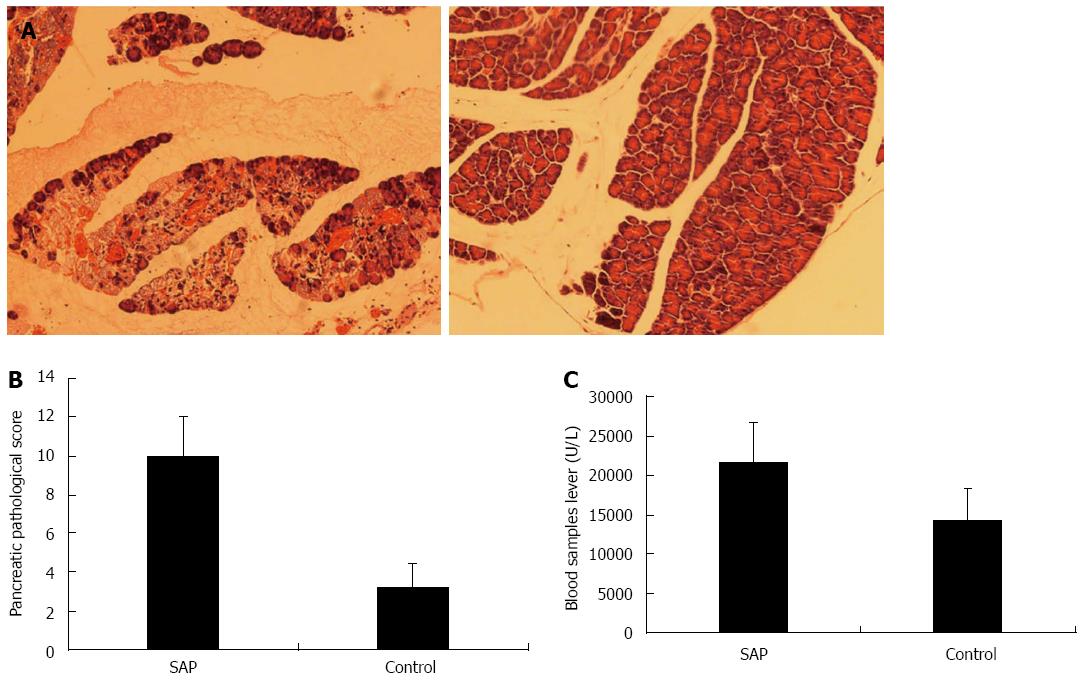
Figure 1 Pancreas histology and serum amylase level in severe acute pancreatitis and control mice.
A: Representative photomicrographs of the pancreas in severe acute pancreatitis (SAP) (left panel) and control (right panel) mice (hematoxylin-eosin, × 100); B: Schmidt’s acute pancreatic damage scores in SAP and control mice, P < 0.01 vs control; C: Serum amylase levels in SAP and control mice, P < 0.01 vs control.
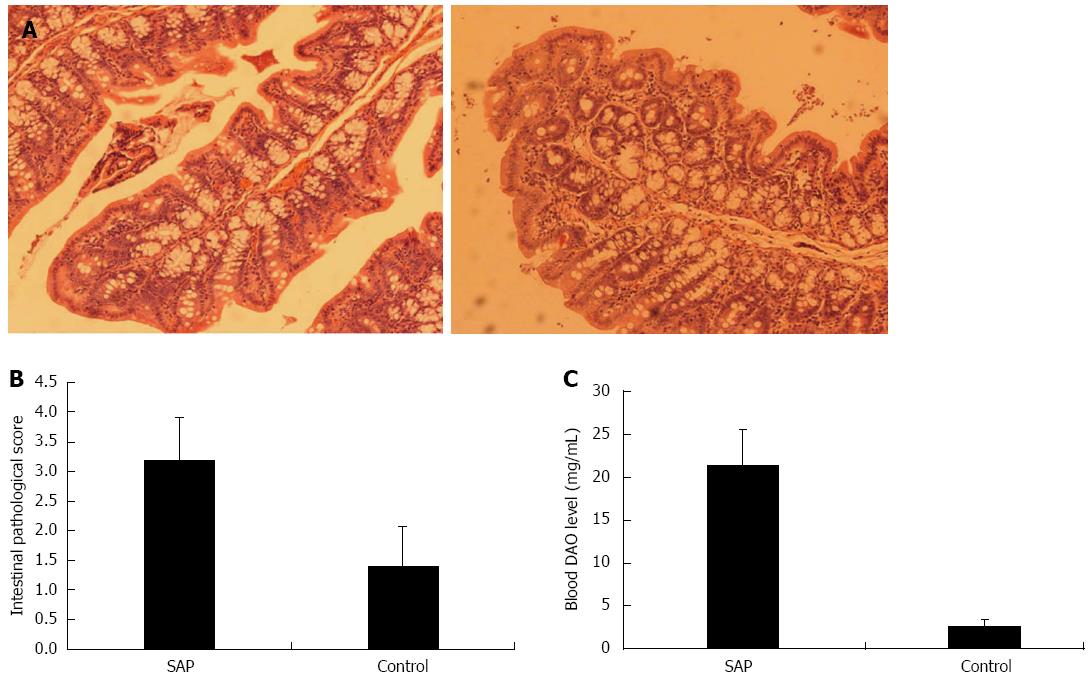
Figure 2 Intestine histology and serum diamine oxidase levels in severe acute pancreatitis and control mice.
A: Representative photomicrographs of the intestine in severe acute pancreatitis (SAP) (left panel) and control (right panel) mice (hematoxylin-eosin, × 100); B: Intestinal barrier damage scores in SAP and control mice, P < 0.01 vs control; C: serum diamine oxidase (DAO) levels in SAP and control mice, P < 0.01 vs control.
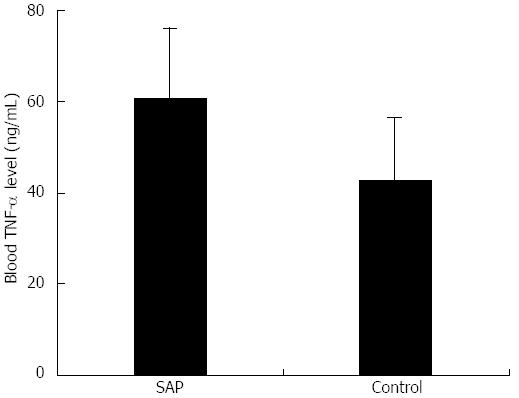
Figure 3 Serum tumor necrosis factor-α levels in severe acute pancreatitis and control mice.
Serum tumor necrosis factor-α level was measured using ELISA; P < 0.01 vs control. SAP: Severe acute pancreatitis.
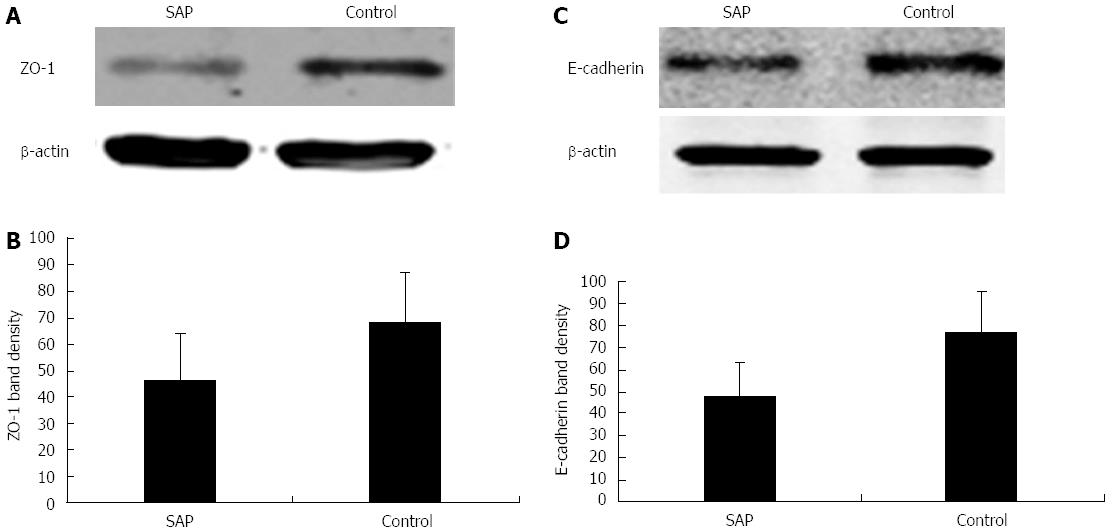
Figure 4 Expressions of zonula occludens-1 and E-cadherin in the intestinal epithelia of severe acute pancreatitis and control mice.
A: Representative western blots showing zonula occludens (ZO)-1 downregulation in SAP mice, with β-actin as an internal control; B: Quantification of ZO-1 expression in SAP and control mice, bP < 0.01 vs control; C: Representative western blots showing E-cadherin downregulation in SAP mice, with β-actin as an internal control; D: Quantification of E-cadherin expression in SAP and control mice, P < 0.01 vs control. SAP: Severe acute pancreatitis.
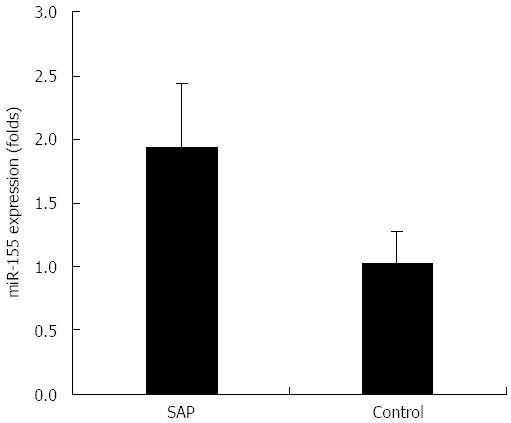
Figure 5 TaqMan miRNA real-time reverse transcriptase polymerase chain reaction for miRNA-155 expression in severe acute pancreatitis and control mice.
Quantification of miRNA (miR)-155 expression level was normalized to that of U6 expression; P < 0.01 vs control. SAP: Severe acute pancreatitis.
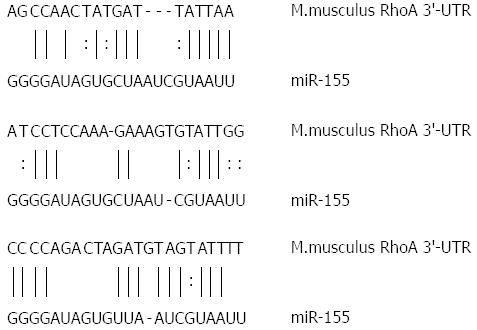
Figure 6 Sequence of miRNA-155 and 3′-untranslated region of Ras homolog gene family, member A gene.
Ras homolog gene family, member A (RhoA) mRNA contains three miR-155 specific binding sites in the 3′-untranslated region (UTR). Vertical lines and columns indicate the Watson-Crick and wobble base pairing, respectively.
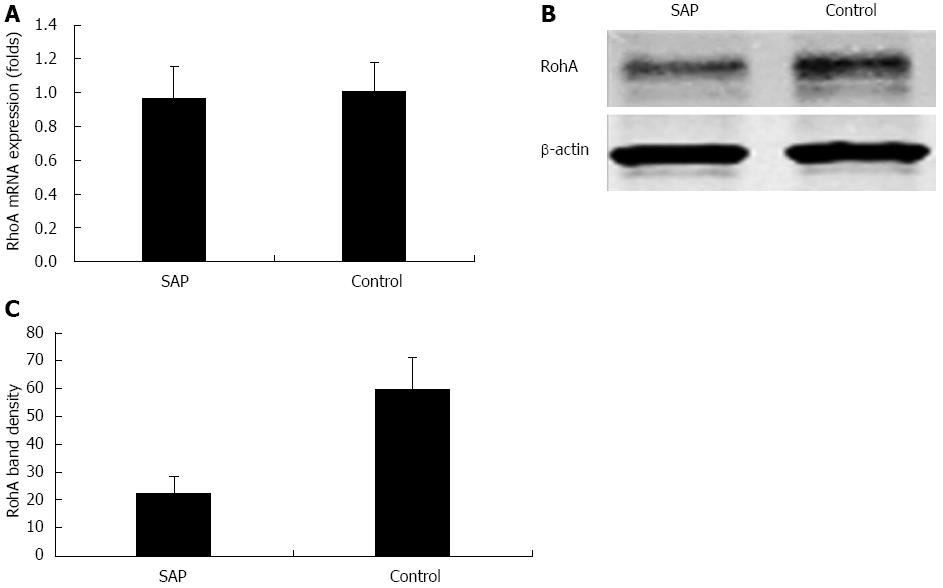
Figure 7 Expressions of Ras homolog gene family, member A mRNA and protein in the intestinal epithelia of severe acute pancreatitis and control mice.
A: Real-time reverse transcriptase polymerase chain reaction showing the relative level of Ras homolog gene family, member A (RhoA) mRNA expression normalized to that of β-actin, P > 0.05 vs control; B: Representative western blots showing RhoA protein expression downregulation in severe acute pancreatitis (SAP) mice, with β-actin as an internal control; C: Quantification of RhoA protein expression in SAP and control mice, P < 0.01 vs control.
- Citation: Tian R, Wang RL, Xie H, Jin W, Yu KL. Overexpressed miRNA-155 dysregulates intestinal epithelial apical junctional complex in severe acute pancreatitis. World J Gastroenterol 2013; 19(45): 8282-8291
- URL: https://www.wjgnet.com/1007-9327/full/v19/i45/8282.htm
- DOI: https://dx.doi.org/10.3748/wjg.v19.i45.8282


