Copyright
©2013 Baishideng Publishing Group Co.
World J Gastroenterol. Dec 7, 2013; 19(45): 8269-8281
Published online Dec 7, 2013. doi: 10.3748/wjg.v19.i45.8269
Published online Dec 7, 2013. doi: 10.3748/wjg.v19.i45.8269
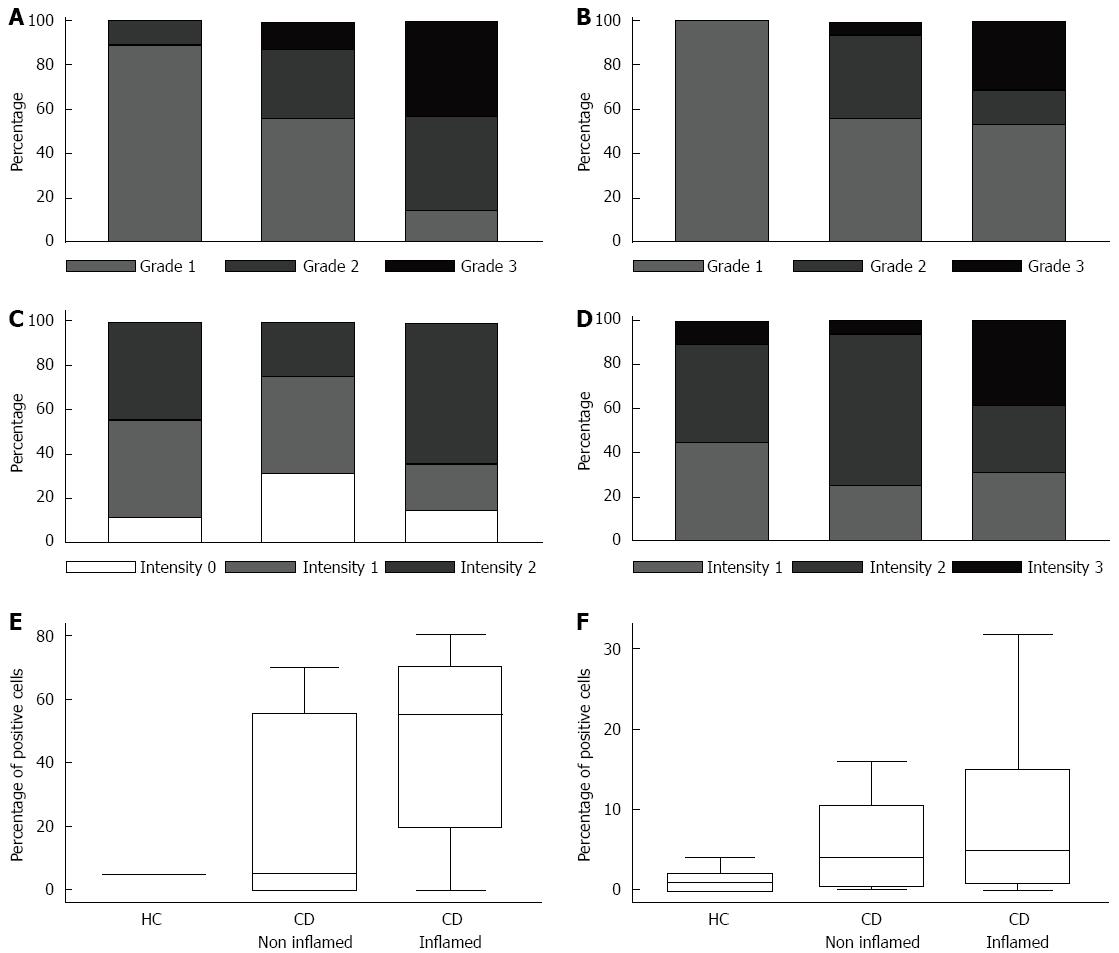
Figure 1 Receptor for the advanced glycation end products expression.
The percentage of samples in each category of both grading (A and B) and intensity (C and D) staining, and the number of positive cells (E and F) are reported. The average values of receptor for the advanced glycation end products (RAGE) immunoreactivity detected at the epithelial (A and C) and the lamina propria (B and D) compartments of patients suffering from Crohn’s disease (CD) and the control subjects (HC) are given. In CD patients, the averages of assessments between the areas of diseased mucosa and the areas of non-diseased mucosa were also compared. Moreover, the number of positive cells in the epithelial compartment (E) was calculated by a differential count of at least 500 cells and the results expressed as a percentage, while in the lamina propria (F) compartment, it was performed by differential counts of positive cells on 10 high-power microscopic fields per slide (n/10 HPF), and the results displayed as the mean number of positive cells. A higher, but not statistically significant, number of RAGE+ cells were observed in both diseased and non-diseased areas of CD patients in comparison with normal tissue of HC. The box-plots in panels E and F show median, 25th, and 75th percentile and extremes.
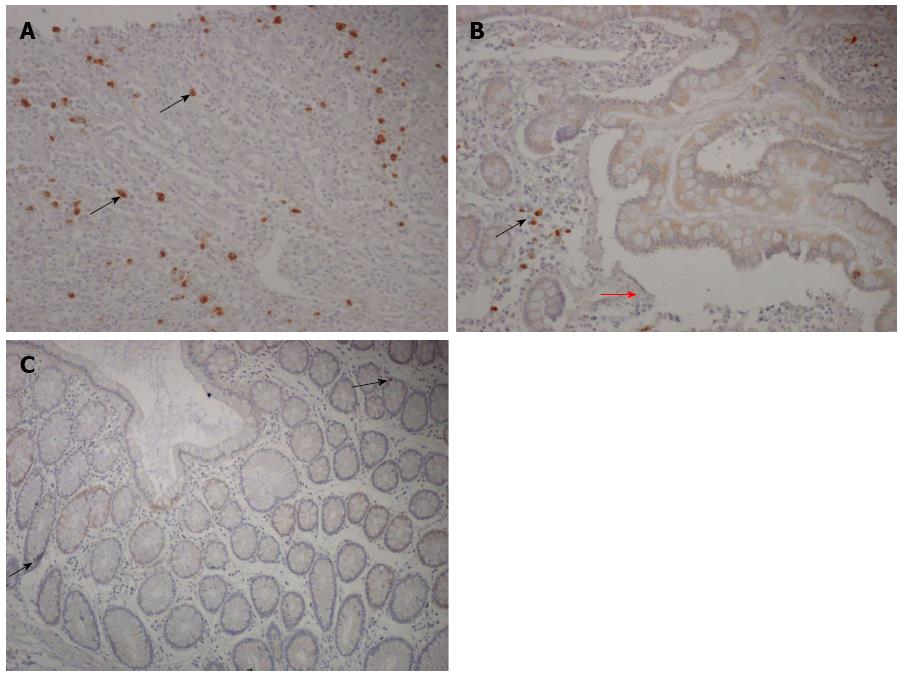
Figure 2 Receptor for the advanced glycation end products staining in Crohn’s disease and healthy mucosa.
A: Almost all cells of the epithelial compartment at both crypt and surface levels showed positive immunostaining (brown cells) in a representative case of Crohn’s disease affected areas, with only a few scattered positive cells in the lamina propria (black arrows); B: The pattern of the cellular staining in the crypt zone of a representative case of Crohn’s disease affected area is shown, indicating both membranous and cytosolic distribution; C: A representative case of control mucosa is shown, with weak staining of the epithelial cells and only a few scattered positive cells in the lamina propria (receptor for the advanced glycation end products, immunoperoxidase-hematoxylin; original magnification, × 200).
Figure 3 Receptor for the advanced glycation end products staining in Crohn’s disease and healthy mucosa lamina propria.
A: Many lamina propria mononuclear cells proved receptor for the advanced glycation end products (RAGE)-positive (the brown cells) in a representative case of Crohn’s disease affected areas; B: A cluster of RAGE-positive lamina propria mononuclear cells next to an ulceration (red arrow) in a representative case of Crohn’s disease affected area showing a cytosolic distribution; C: A representative case of control mucosa is shown, with weak staining of a few lamina propria mononuclear cells (black arrow) (RAGE immunoperoxidase-hematoxylin; original magnification, × 200).
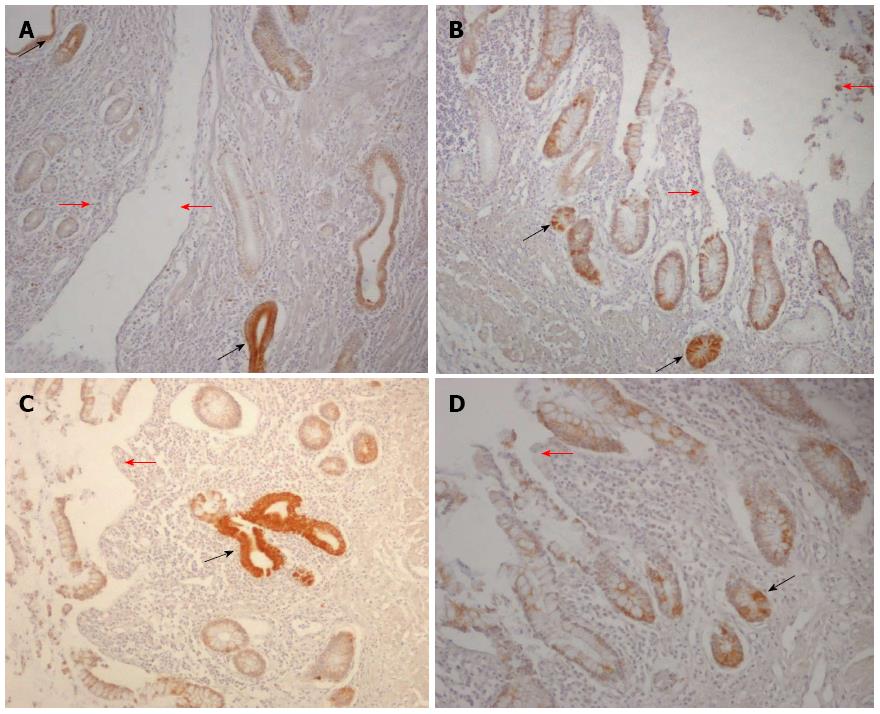
Figure 4 Receptor for the advanced glycation end products staining in Crohn’s disease ulcerative areas.
A: Almost all cells of the epithelial compartment in close proximity to an ulceration (red arrows) proved receptor for the advanced glycation end products (RAGE)-positive (the brown cells), with the ulcer-associated cell lineage showing the highest immunoreactivity (black arrows); B and C: A detail of the epithelial cells in the crypt compartment at level of an ulceration (red arrows) showing moderate to strong RAGE-positive staining (black arrows); D: A detail of the epithelial cells of the surface compartment next to an ulceration (red arrow) showing strong RAGE immunoreactivity (black arrows) (RAGE immunoperoxidase-hematoxylin; original magnification, × 200).
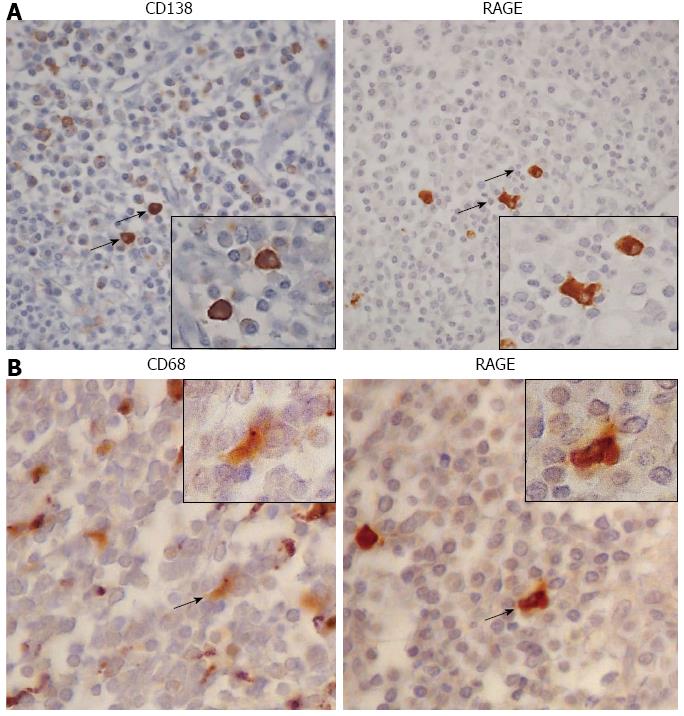
Figure 5 Type of receptor for the advanced glycation end products (+) immune cells.
Representative seriate sections of Crohn’s disease lamina propria with heavy inflammatory infiltrate, in which the correspondence between the positivity for both CD138 (panel A) indicating the plasma cells, and CD68 (panel B) showing the macrophages, with receptor for the advanced glycation end products (+) cells given (Immunoperoxidase-hematoxylin; original magnification, × 200). The same cellular elements indicated by the black arrows are shown in the boxes at higher magnification (Immunoperoxidase-hematoxylin; original magnification, × 400). RAGE: Receptor for the advanced glycation end products.
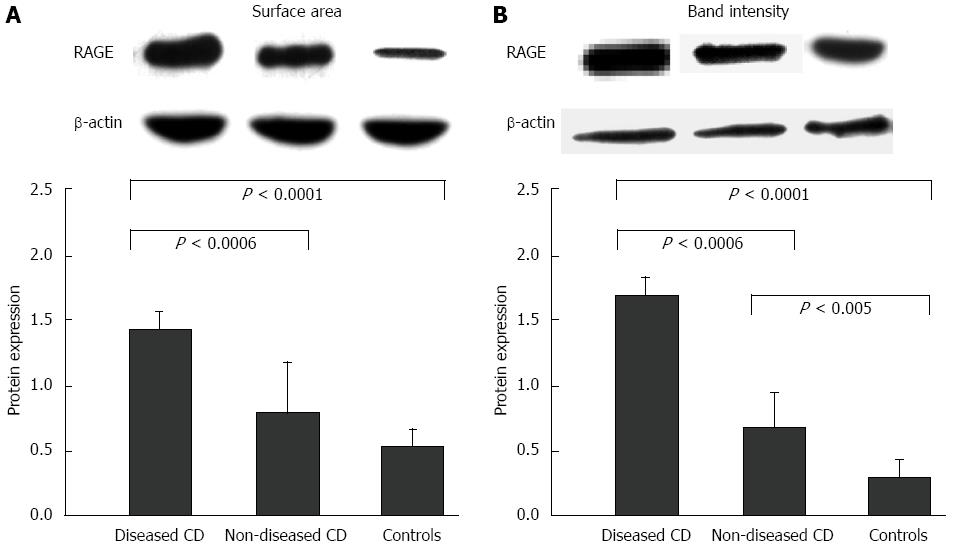
Figure 6 Receptor for the advanced glycation end products expression at mucosal level.
Immunoblotting of mucosal samples from both diseased and non-diseased areas of Crohn’s disease (CD) patients and from normal areas of control patients with the polyclonal anti-receptor for the advanced glycation end products (RAGE) antibody. The protein levels were measured by scanning densitometry as band area (A) and band intensity (B), expressed as arbitrary units, and normalized towards β-actin levels. In the upper part of both panels, representative cases of band area and intensity with respect to those of β-actin are shown. Specifically, the values for RAGE expression in diseased areas for both band area and band intensity were significantly higher (1.48 ± 0.16 and 1.64 ± 0.14, respectively) than those found in non-diseased areas (0.71 ± 0.40 and 0.66 ± 0.23, respectively) and healthy mucosa (0.44 ± 0.17 and 0.27 ± 0.15, respectively).
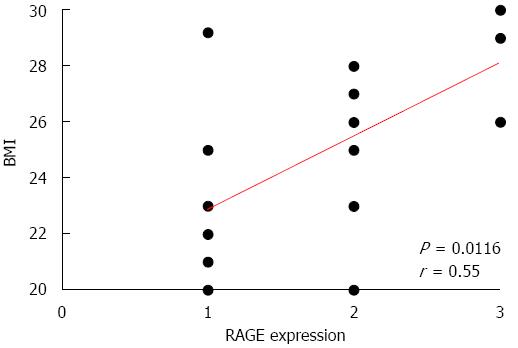
Figure 7 Correlation between receptor for the advanced glycation end products expression and body mass index.
A positive correlation between the grading of receptor for the advanced glycation end products (RAGE) expression in the epithelial compartment of non-diseased Crohn’s mucosa and body mass index (BMI) was clearly evident.
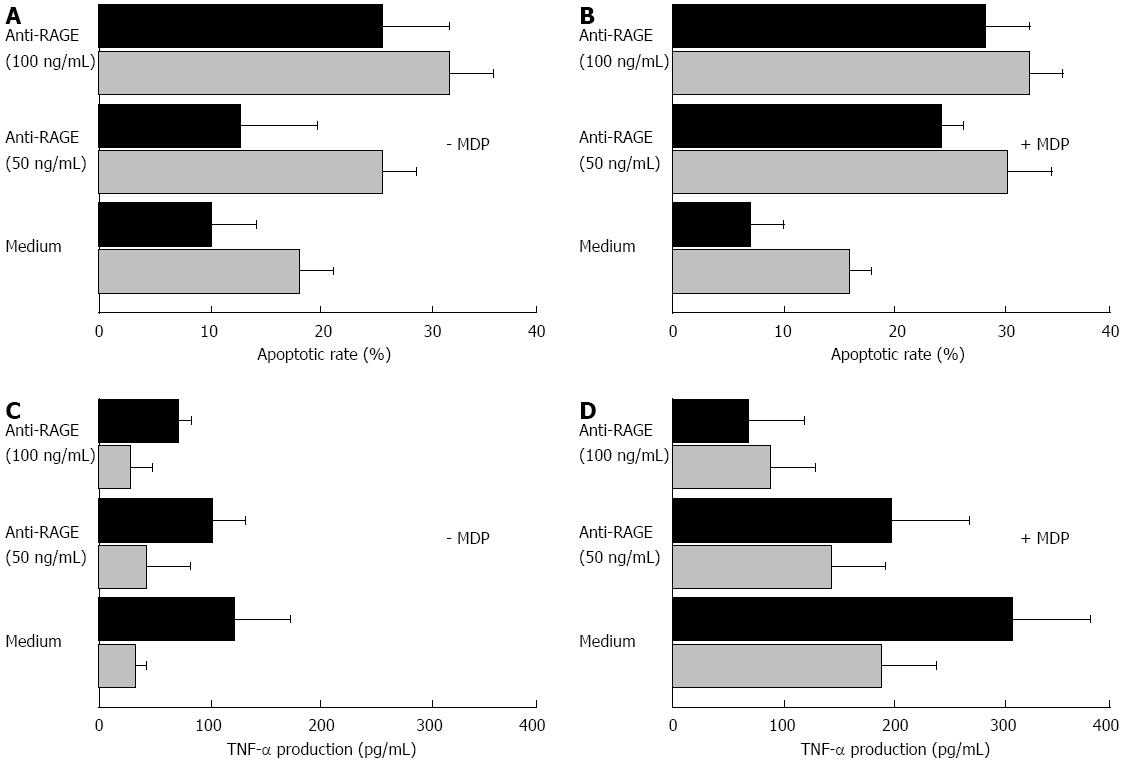
Figure 8 Functional assays.
The in vitro apoptotic rates of lamina propria mononuclear cells (LPMC) incubated in the absence or presence of two different concentrations of the anti-receptor for the advanced glycation end products (RAGE) blocking antibody, and with or without the muramyl dipeptide (MDP) used as antigenic stimulation are given in panels A and B. The analysis was carried out by flow cytometry, and the mean percentage values ± SD of at least three experiments for each condition were the following: in the absence of MDP (A), LPMC from non-diseased mucosa (grey bars) showed a spontaneous apoptotic rate of 18.4 ± 3.1, and a value of 26.9 ± 2.8 and 32.7 ± 4.6 in the presence of 50 and 100 ng/mL concentration of the anti-RAGE blocking antibody, respectively; when using LPMC from diseased mucosa (black bars), a value of spontaneous apoptotic rate of 10.1 ± 4.2 was found, while when incubating with 50 and 100 ng/mL concentration of the anti-RAGE blocking antibody, values of 13.0 ± 6.2 and 26.1 ± 5.5 were found, respectively. In the presence of MDP (B), LPMC from non-diseased mucosa showed a spontaneous apoptotic rate of 15.6 ± 2.1, and values of 31.9 ± 3.8 and 33.3 ± 2.9 in the presence of 50 and 100 ng/mL concentration of the anti-RAGE blocking antibody, respectively; when using LPMC from diseased mucosa, a value of spontaneous apoptotic rate of 7.8 ± 2.6 was found, while when incubating with 50 and 100 ng/mL concentration of the anti-RAGE blocking antibody, values of 24.1 ± 2.2 and 28.0 ± 4.1, respectively, were found. The tumor necrosis factor (TNF)-α production of LPMC cultured in vitro in the absence or presence of two different concentrations of the anti-RAGE blocking antibody, and with or without the MDP as antigenic stimulation are given in the panels C and D. The analysis was carried out by ELISA assay on culture supernatants, and the mean values ± SD were as follows: in the absence of MDP (C), the cytokine level was 32 ± 14 pg/mL in the cultures with LPMC from non-diseased areas, and 124 ± 48 pg/mL in those with LPMC from diseased areas; when incubating with 50 and 100 ng/mL of the anti-RAGE blocking antibody, values of 41 ± 38 and 27 ± 21 pg/mL for LPMC from non-diseased areas, and of 102 ± 29 and 67 ± 11 pg/mL for LPMC from diseased areas, respectively, were observed. In the presence of MDP (D), the TNF-α level was 184 ± 49 pg/mL in the cultures with LPMC from non-diseased areas, and 307 ± 68 pg/mL in those with LPMC from diseased areas; when incubating with 50 and 100 ng/mL of the anti-RAGE blocking antibody, values of 138 ± 50 and 87 ± 41 pg/mL for LPMC from non-diseased areas, and of 198 ± 68 and 71 ± 47 pg/mL for LPMC from diseased areas, respectively, were observed.
- Citation: Ciccocioppo R, Vanoli A, Klersy C, Imbesi V, Boccaccio V, Manca R, Betti E, Cangemi GC, Strada E, Besio R, Rossi A, Falcone C, Ardizzone S, Fociani P, Danelli P, Corazza GR. Role of the advanced glycation end products receptor in Crohn’s disease inflammation. World J Gastroenterol 2013; 19(45): 8269-8281
- URL: https://www.wjgnet.com/1007-9327/full/v19/i45/8269.htm
- DOI: https://dx.doi.org/10.3748/wjg.v19.i45.8269


