Copyright
©2013 Baishideng Publishing Group Co.
World J Gastroenterol. Nov 14, 2013; 19(42): 7412-7418
Published online Nov 14, 2013. doi: 10.3748/wjg.v19.i42.7412
Published online Nov 14, 2013. doi: 10.3748/wjg.v19.i42.7412
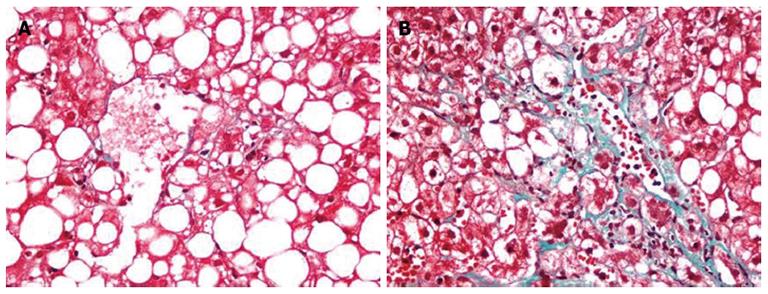
Figure 1 Mild perivenular-perisinusoidal fibrosis (A) and advanced perivenular-perisinusoidal, and periportal fibrosis (B) in non-alcoholic steatohepatitis.
A, B: Trichrome stain, x 400.
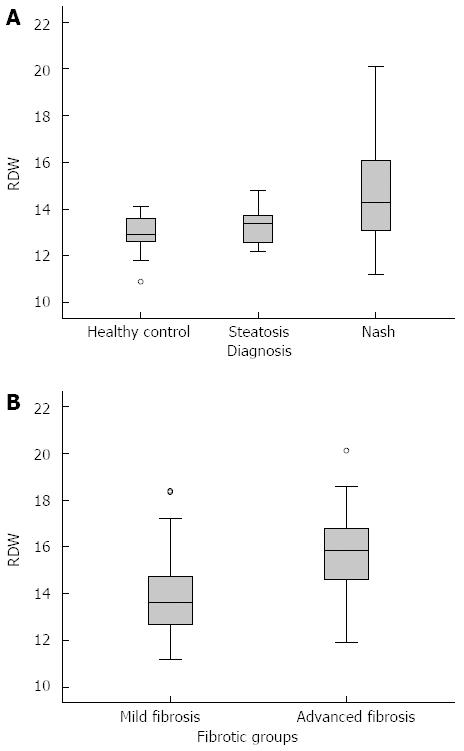
Figure 2 Red cell distribution width values of healthy controls, simple steatosis and non-alcoholic steatohepatitis groups (A), and fibrotic subgroups of non-alcoholic steatohepatitis (B).
RDW: Red cell distribution width.
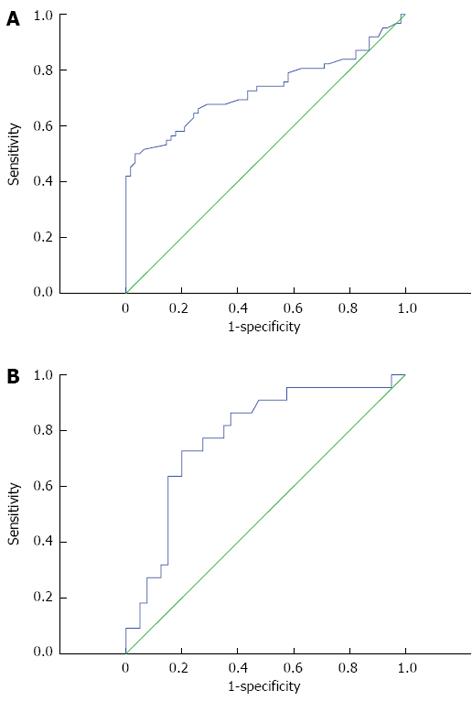
Figure 3 Receiver operating characteristics curve of red cell distribution width values for the identification of patients with non-alcoholic steatohepatitis (A), and the identification of fibrosis in non-alcoholic steatohepatitis (B).
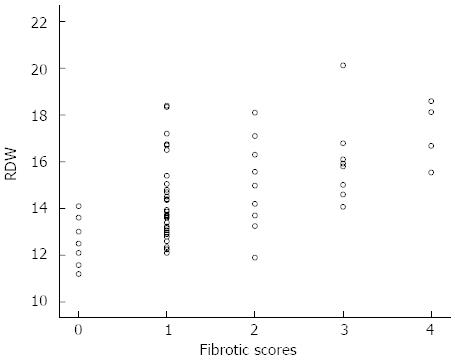
Figure 4 Correlation between red cell distribution width values and fibrotic scores of non-alcoholic steatohepatitis.
RDW: Red cell distribution width. Score 0, n = 8; Score 1, n = 32; Score 2, n = 10; Score 3, n = 8; Score 4, n = 4
- Citation: Cengiz M, Candır BA, Yılmaz G, Akyol G, Ozenirler S. Is increased red cell distribution width an indicating marker of nonalcoholic steatohepatitis and fibrotic stage? World J Gastroenterol 2013; 19(42): 7412-7418
- URL: https://www.wjgnet.com/1007-9327/full/v19/i42/7412.htm
- DOI: https://dx.doi.org/10.3748/wjg.v19.i42.7412


