Copyright
©2013 Baishideng Publishing Group Co.
World J Gastroenterol. Nov 7, 2013; 19(41): 7146-7153
Published online Nov 7, 2013. doi: 10.3748/wjg.v19.i41.7146
Published online Nov 7, 2013. doi: 10.3748/wjg.v19.i41.7146
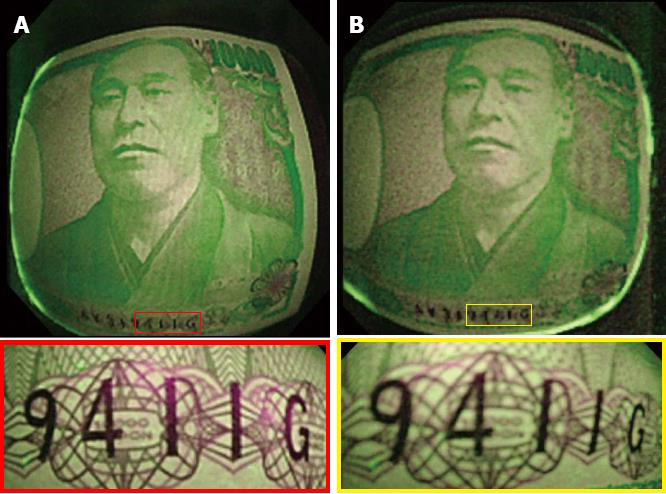
Figure 1 Comparisons of images obtained with the previous autofluorescence imaging system and with the novel autofluorescence imaging system.
The major improvement in the novel autofluorescence imaging (AFI) system is in the image-processing algorithm, specifically the noise-reduction algorithm, which results in higher resolution images with less noise interference. An AFI image from the previous AFI system (A: EVIS LUSERA ERITE CLV-290) is clearer than an image from the novel AFI system (B: EVIS LUSERA CLV-260).
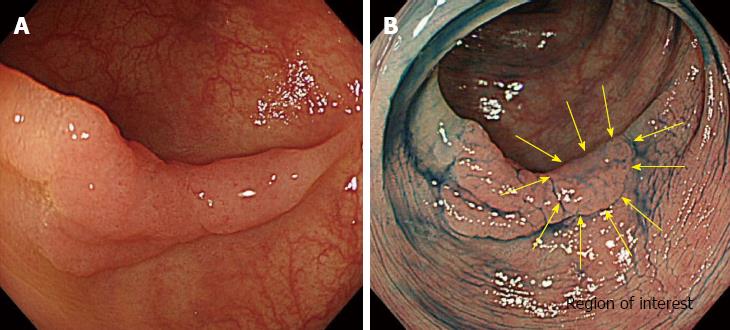
Figure 2 A determination of region of interest.
A: A white light image of a flatelevated lesion located in the sigmoid colon; B: A depressed area observed on chromoendoscopy (the area surrounded by yellow arrows). The region of interest for color tone analysis was chosen by the endoscopist based on the findings of non-magnifying narrow-band imaging or chromoendoscopy.
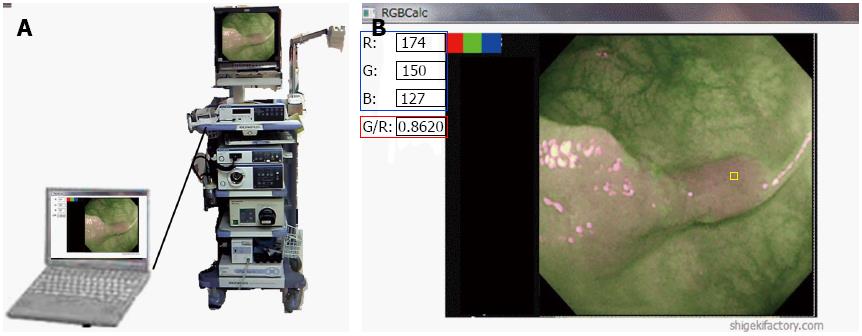
Figure 3 A method for real-time color intensity analysis calculated software.
A: A personal computer with software that enables real-time color tone analysis was connected to the endoscopy system. B: The user interface of the personal computer for color tone analysis. The region of interest was chosen using the cursor (yellow square). The color tone intensity (blue square) and the green/red ratio (red square), which is obtained by dividing the green color tone intensity by the red color tone intensity, were calculated automatically.
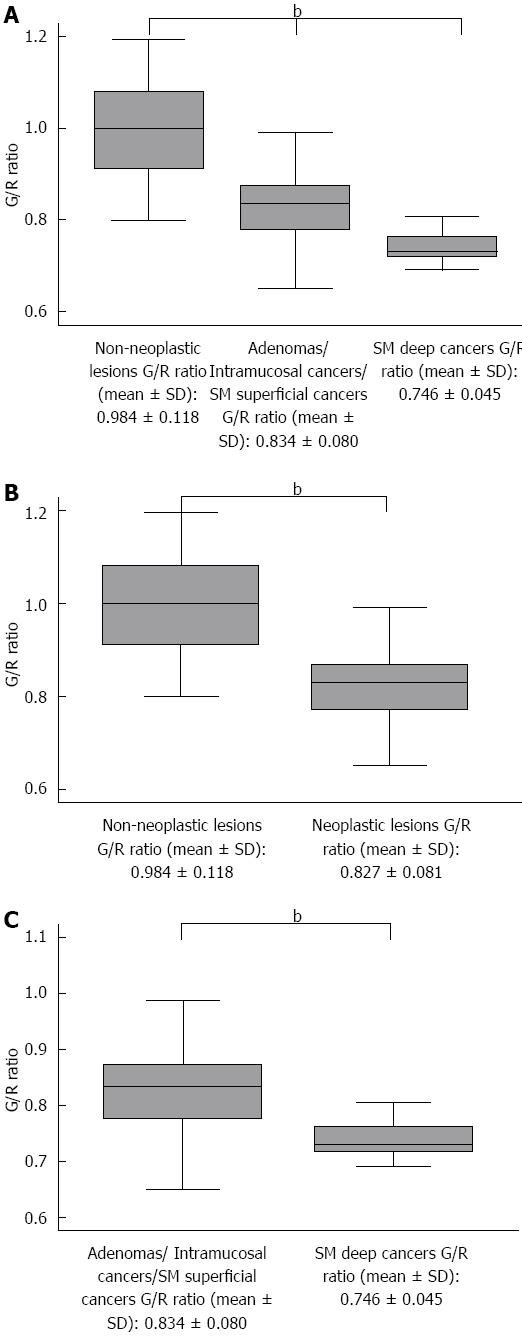
Figure 4 Distribution of green/red ratios.
A: Between non-neoplastic lesions, adenoma/intramucosal cancer/submucosal (SM) superficial cancer, and SM deep cancer, there was a significant difference in the green/red (G/R) ratios of non-neoplastic lesions, adenomas/intramucosal cancer/SM superficial cancer, and SM deep cancer (bP < 0.01); B: Between non-neoplastic lesions and neoplastic lesions, There was a significant difference between non-neoplastic and neoplastic lesions (bP < 0.01); C: Between adenoma/intramucosal cancer/SM superficial cancer, and SM deep cancer, there was a significant difference between the two groups (bP < 0.01). SM superficial cancer: Submucosal invasion was defined as less than 1000 μm from the muscularis mucosae; SM deep cancer: Submucosal invasion was defined as 1000 μm or more from the muscularis mucosae.
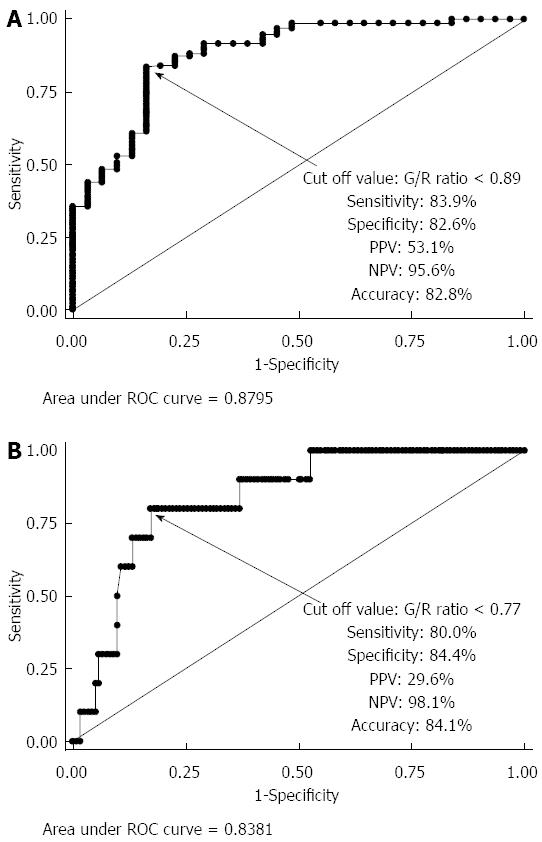
Figure 5 Receiver operating characteristic curve.
A: For discriminating between hyperplastic polyps and neoplastic lesions, the area under the receiver operating characteristic curve (AUC) was 0.8795; B: For discriminating between adenoma/intramucosal cancer/SM superficial cancer and SM deep cancer, the area under AUC was 0.8381. G/R: Green/red.
- Citation: Inomata H, Tamai N, Aihara H, Sumiyama K, Saito S, Kato T, Tajiri H. Efficacy of a novel auto-fluorescence imaging system with computer-assisted color analysis for assessment of colorectal lesions. World J Gastroenterol 2013; 19(41): 7146-7153
- URL: https://www.wjgnet.com/1007-9327/full/v19/i41/7146.htm
- DOI: https://dx.doi.org/10.3748/wjg.v19.i41.7146


