Copyright
©2013 Baishideng Publishing Group Co.
World J Gastroenterol. Nov 7, 2013; 19(41): 7121-7128
Published online Nov 7, 2013. doi: 10.3748/wjg.v19.i41.7121
Published online Nov 7, 2013. doi: 10.3748/wjg.v19.i41.7121
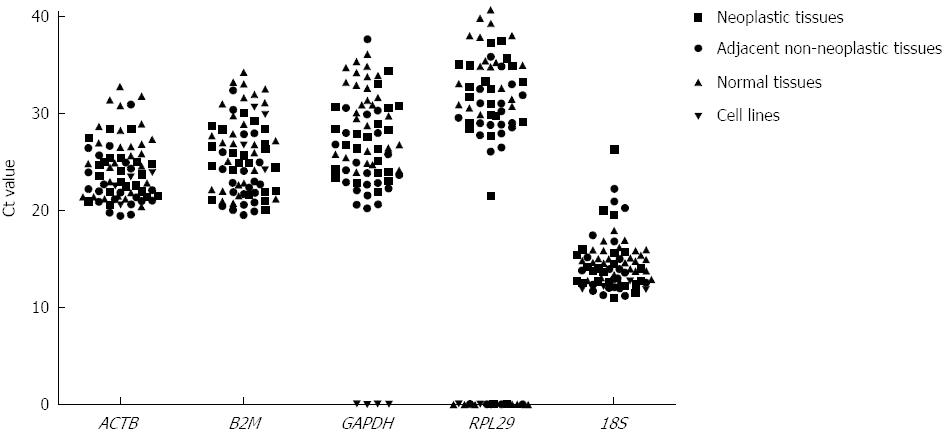
Figure 1 Expression level of five candidate reference genes detected by quantitative real-time polymerase chain reaction.
A lower cycle threshold (Ct) value indicates higher gene expression.
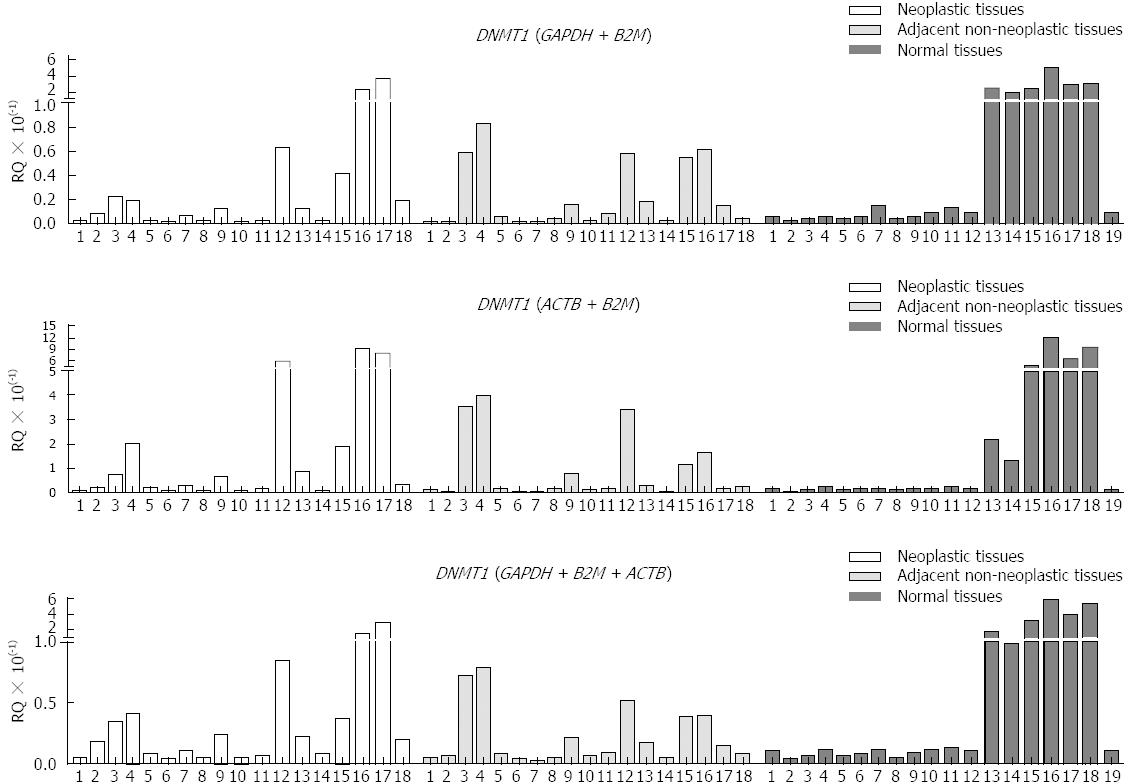
Figure 2 Relative quantification of DNMT1, as normalized by GAPDH + B2M, ACTB + B2M, and GAPDH + B2M + ACTB in gastric tissues.
- Citation: Wisnieski F, Calcagno DQ, Leal MF, Santos LCD, Gigek CO, Chen ES, Pontes TB, Assumpção PP, Assumpção MB, Demachki S, Burbano RR, Smith MAC. Reference genes for quantitative RT-PCR data in gastric tissues and cell lines. World J Gastroenterol 2013; 19(41): 7121-7128
- URL: https://www.wjgnet.com/1007-9327/full/v19/i41/7121.htm
- DOI: https://dx.doi.org/10.3748/wjg.v19.i41.7121


