Copyright
©2013 Baishideng Publishing Group Co.
World J Gastroenterol. Jan 28, 2013; 19(4): 482-491
Published online Jan 28, 2013. doi: 10.3748/wjg.v19.i4.482
Published online Jan 28, 2013. doi: 10.3748/wjg.v19.i4.482
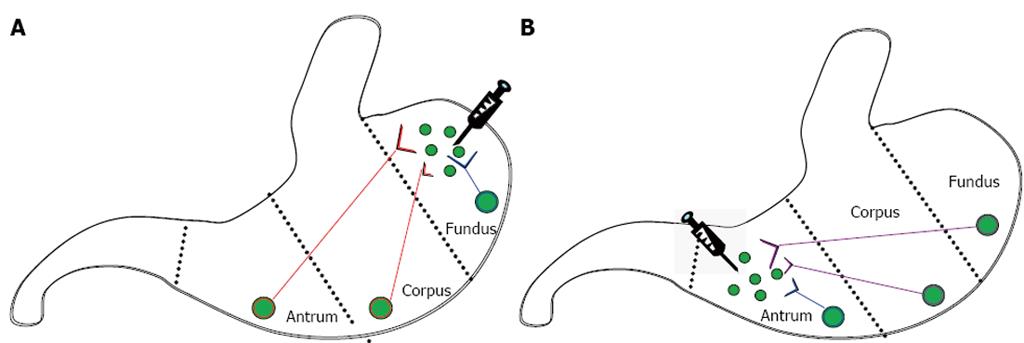
Figure 1 Cartoon of ascending, descending and local enteric pathways in the stomach.
Enteric nerve terminals endocytosed the tracer fluorogold (small green circles) and it was transported back to cell bodies (large green circles) located in the fundus, corpus, or antrum. A: The retrograde tracer fluorogold was injected into the fundus. Red neurons were in the ascending pathway while blue neurons were in the local fundic pathway. The approximate distances from fundus injection sites were 0.6, 2.2, and 3.3 cm for fundus, corpus, and antrum sections, respectively; B: The retrograde tracer fluorogold was injected into the antrum. Purple neurons were in the descending pathway while blue neurons were in the local antral pathway. The approximate distances from antrum injection sites were 3.2, 1.1, and 0.4 cm for fundus, corpus, and antrum sections, respectively.
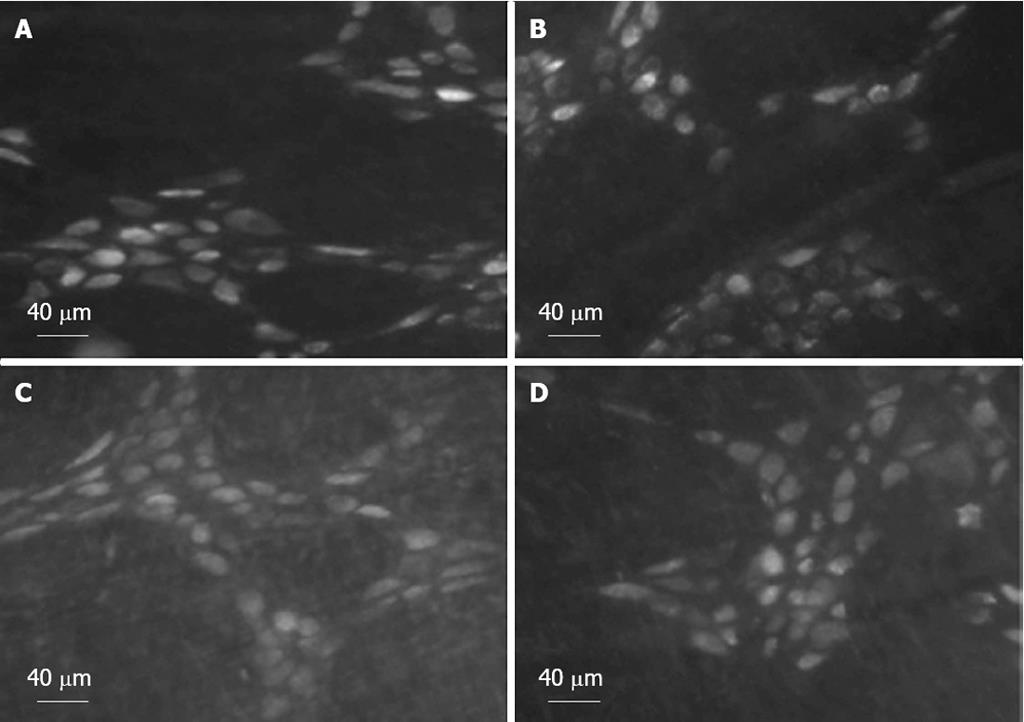
Figure 2 Fluorogold-labeled enteric neurons in gastric corpus.
A: Fluorogold-labeled ascending enteric neurons in KK mice; B: Fluorogold-labeled ascending enteric neurons in KKAy mice; C: Fluorogold-labeled descending enteric neurons in KK mice; D: Fluorogold-labeled descending enteric neurons in KKAy mice. The brightness of neurons varied depending on the amount of fluorogold transported to the cell body, but most neurons in the ganglia were labeled with fluorogold.
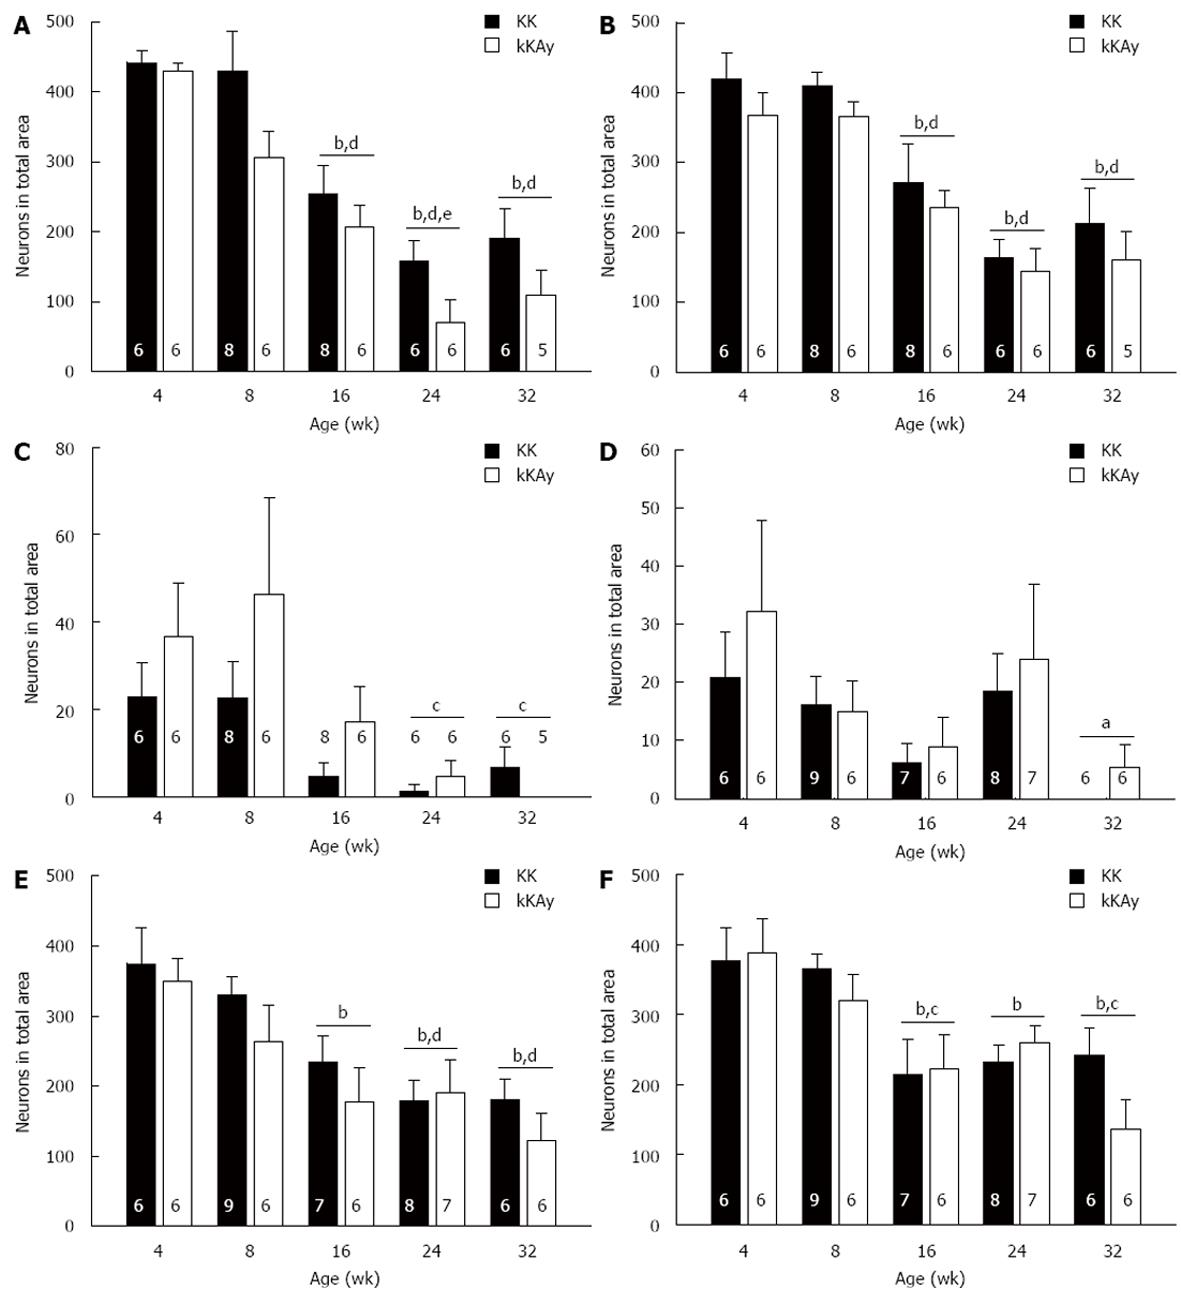
Figure 3 Number of fluorogold-labeled neurons in enteric neural pathways in 4-32 wk old KK and KKAy mice.
A: Long ascending pathway: The number of fluorogold (FG)-labeled neurons was significantly decreased in KKAy as compared to KK mice [main effect: F (1, 53) = 8.136, P = 0.006]. The numbers of FG-labeled neurons began to decrease with age in KK and KKAy mice at 16 wk of age with the fewest neurons detected at 24 wk of age [main effect: F (4, 53) = 24.936, P < 0.001]; B: Short ascending pathway: There was a trend for the numbers of FG-labeled neurons to be reduced in KKAy as compared to KK mice [main effect: F (1, 53) = 2.940, P = 0.092]. The number of FG-labeled neurons decreased with age in KK and KKAy mice [main effect: F (4, 53) = 17.188, P < 0.001]. By 16 wk of age, the numbers of FG-labeled neurons were reduced and remained low; C: Fundus: Similar numbers of FG-labeled neurons were observed in KK and KKAy mice [main effect: F (1, 53) = 2.464, P = 0.122]. In KK and KKAy mice, the numbers of labeled FG neurons were highest at 8 wk and lowest at 24 and 32 wk [main effect: F (4, 53) = 5.195, P = 0.001]; D: Long descending pathway: Similar numbers of FG-labeled neurons were observed in KK and KKAy mice [main effect: F (1, 57) = 0.922, P = 0.341]. By 32 wk of age, the numbers of FG-labeled neurons were reduced as compared to younger ages [main effect: F (4, 57) = 2.944, P = 0.028]; E: Short descending pathway: Similar numbers of FG-labeled neurons were observed in KK and KKAy mice [main effect: F (1, 57) = 2.374, P = 0.129]. The numbers of FG-labeled neurons began to decrease in KK and KKAy mice at 16 wk of age with the fewest neurons detected at 24 wk of age [main effect: F (4, 57) = 9.336, P < 0.001]; F: Antrum: Similar numbers of FG-labeled neurons were observed in KK and KKAy mice [main effect: F (1, 57) = 0.728, P = 0.397]. By 16 wk of age, the numbers of FG-labeled neurons were reduced as compared to 4 and 8 wk of age [main effect: F (4, 57) = 8.920, P < 0.001]. aP < 0.05, bP < 0.01 vs 4 wk; cP < 0.05, dP < 0.01 vs 8 wk; eP < 0.05 vs 16 wk.
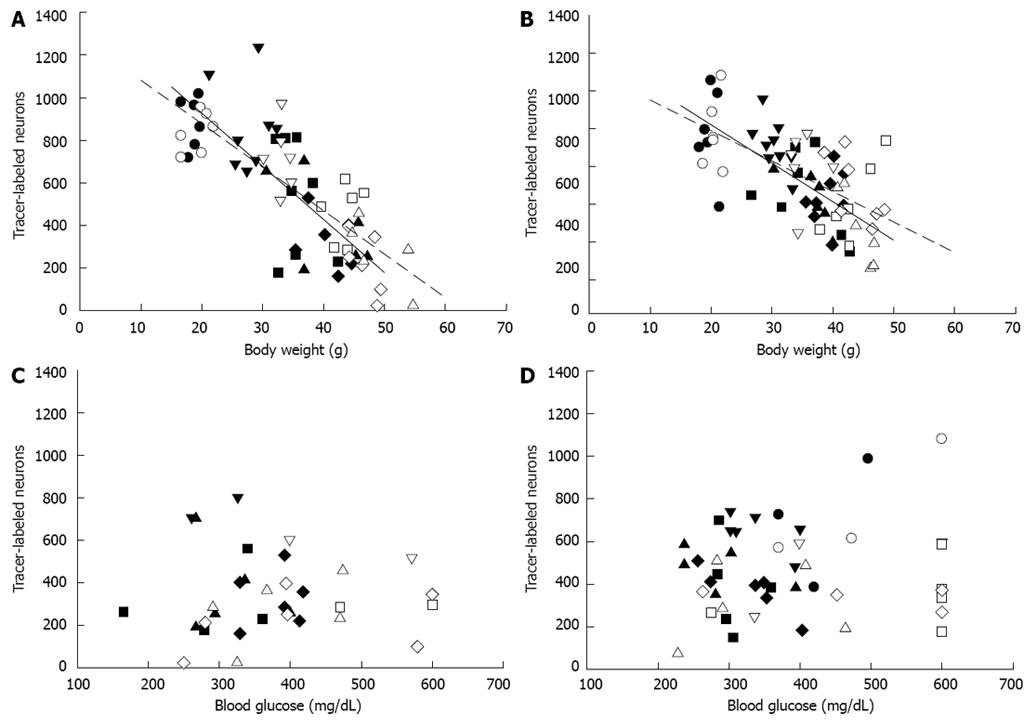
Figure 4 Correlation of body weight or stress-elevated blood glucose with number of tracer-labeled enteric neurons.
A: Body weight was correlated with number of neurons labeled by fundus injection (KK mice, r2 = 0.4362; KKAy mice, r2 = 0.3868); B: Body weight was correlated with number of neurons labeled by antrum injection (KK mice, r2 = 0.5565; KKAy mice, r2 = 0.7087); C: Stress-elevated blood glucose was not correlated with number of neurons labeled by fundus injection (KK mice, r2 = 0.0093; KKAy mice, r2 = 0.108); D: Stress-elevated blood glucose was not correlated with number of neurons labeled by antrum injection (KK mice, r2 = 0.0301; KKAy mice, r2 = 0.0947). Legend: Black symbols and solid line, KK mice; white symbols and dashed line, KKAy mice; circle, 4 wk; inverted triangle, 8 wk; square, 16 wk; diamond, 24 wk; upright triangle, 32 wk.
- Citation: LePard KJ, Cellini J. Age-dependent slowing of enteric axonal transport in insulin-resistant mice. World J Gastroenterol 2013; 19(4): 482-491
- URL: https://www.wjgnet.com/1007-9327/full/v19/i4/482.htm
- DOI: https://dx.doi.org/10.3748/wjg.v19.i4.482


