Copyright
©2013 Baishideng Publishing Group Co.
World J Gastroenterol. Oct 7, 2013; 19(37): 6170-6177
Published online Oct 7, 2013. doi: 10.3748/wjg.v19.i37.6170
Published online Oct 7, 2013. doi: 10.3748/wjg.v19.i37.6170
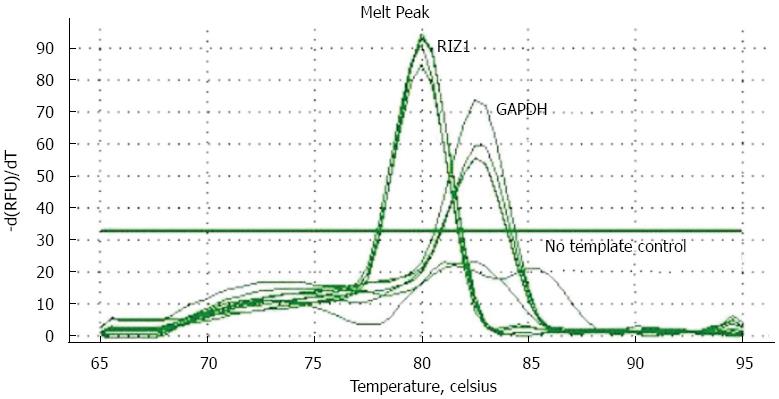
Figure 1 Solubility temperature curves for RIZ1 and glyceraldehyde 3-phosphate dehydrogenase showing that transfection was successful.
DAPDH: Glyceraldehyde 3-phosphate dehydrogenase.
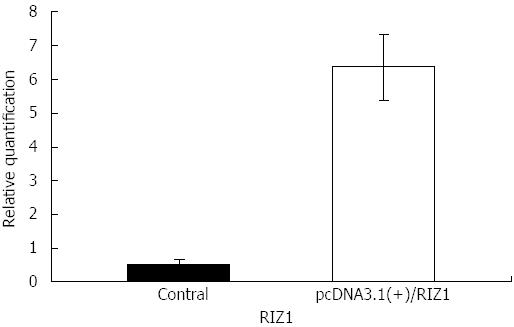
Figure 2 Histogram of RIZ1 gene mRNA expression levels in the blank control group and pcDNA3.
1(+)/RIZ1 recombinant plasmid group, clearly showing that gene expression is higher in the pcDNA3.1(+)/RIZ1 group (P≤ 0.01).
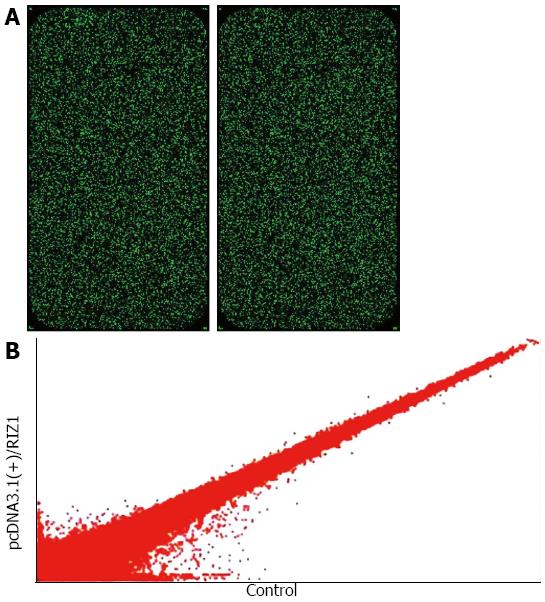
Figure 3 Alteration of gene expression profile.
A: Single fluorescence chip images for microarray analysis; B: The data were used to construct the scatter plot. Hybridization signal strength scatter diagram. Each point in the scatter diagram represents a probe point on the chip. The position of each point is identified by an x and y coordinate: the x-coordinate gives the standardized signal value on the control chip; the y-coordinate gives the standardized signal value on the sample chip. The scatter plot is used to assess the centralized tendency of two sets of data.
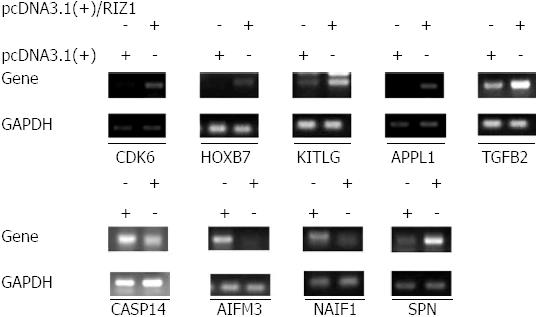
Figure 4 Comparison between results from the gene chip and the reverse transcription-polymerase chain reaction.
Out of the nine genes tested, eight yielded consistent results for both reverse transcription-polymerase chain reaction and gene chip. The five upregulated genes are CDK6, HOXB7, KITLG, APPL1, TGFB2; and the three downregulated genes are CASP14, AIFM3 and NAIF1; however, in the case of service principal name (SPN), the reverse transcription-polymerase chain reaction results indicate upregulation, whereas the gene chip results indicate downregulation.
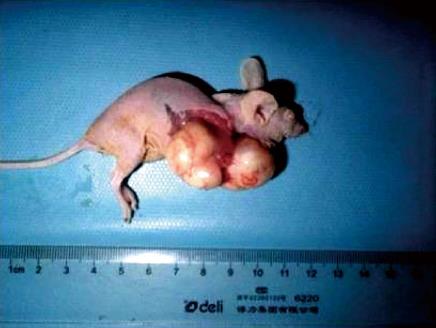
Figure 5 Photograph showing tumor development in a nude mouse, confirming successful transplantation of human esophageal cancer into an animal model.
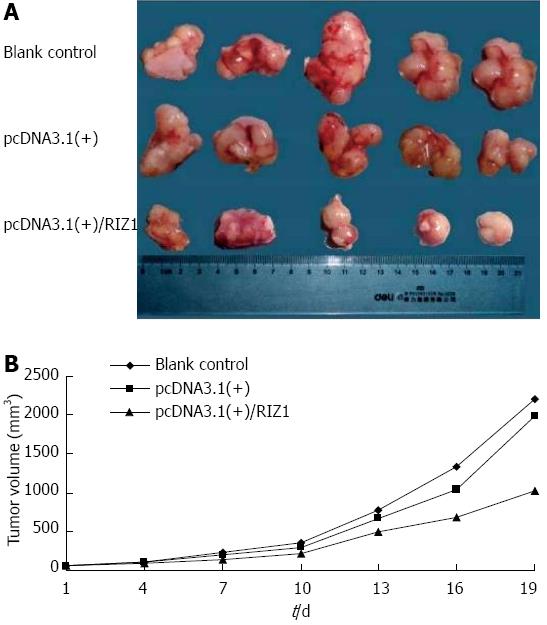
Figure 6 Transplantation and tumor growth.
A: Photograph comparing esophageal squamous cell carcinomas removed from nude mice of the three groups after 26 d; B: Growth rate curves showing the increase in tumor volumes with time. The shallower curve in the pcDNA3.1(+)/RIZ1 group, compared to the blank control and pcDNA3.1(+) groups, indicates slower growth.
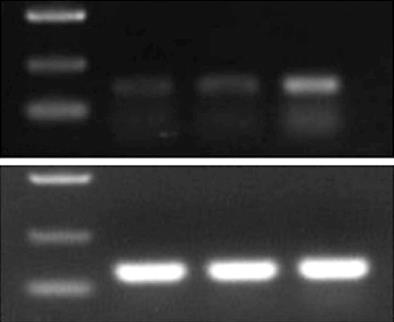
Figure 7 Electrophoresis gel image showing bands for glyceraldehyde 3-phosphate dehydrogenase (125 bp) and RIZI (167 bp).
The intensity of the RIZ1 band is greatest in the pcDNA3.1(+)/RIZ1 group. M: Marker (D2000); N: Blank control; P: pcDNA3.1(+); R: pcDNA3.1(+)/RIZ1; GAPDH: Glyceraldehyde 3-phosphate dehydrogenase.
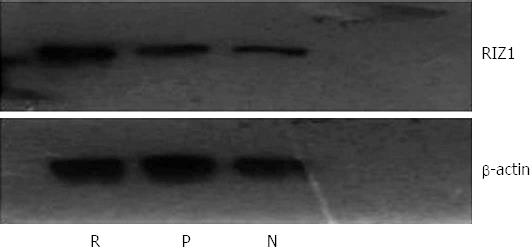
Figure 8 Western blot image for RIZ1 protein expression with β-actin as the control.
The density of the RIZ1 band in the pcDNA3.1(+)/RIZ1 group is higher than in the other groups, indicating increased expression. R: pcDNA3.1(+)/RIZ1; N: Blank control; P: pcDNA3.1(+).
-
Citation: Dong SW, Li D, Xu C, Sun P, Wang YG, Zhang P. Alteration in gene expression profile and oncogenicity of esophageal squamous cell carcinoma by
RIZ1 upregulation. World J Gastroenterol 2013; 19(37): 6170-6177 - URL: https://www.wjgnet.com/1007-9327/full/v19/i37/6170.htm
- DOI: https://dx.doi.org/10.3748/wjg.v19.i37.6170


