Copyright
©2013 Baishideng Publishing Group Co.
World J Gastroenterol. Aug 28, 2013; 19(32): 5250-5260
Published online Aug 28, 2013. doi: 10.3748/wjg.v19.i32.5250
Published online Aug 28, 2013. doi: 10.3748/wjg.v19.i32.5250
Figure 1 Transfusion conditions.
The post-transfusion percentages of human platelets in naïve mice receiving 2.5 × 10⁸, 5.0 × 10⁸, and 10.0 × 10⁸ human platelets. The post-transfusion percentage of human platelets was defined as human platelets/(human platelets + murine platelets). The post-transfusion percentages of human platelets in mice receiving 2.5 × 10⁸, 5.0 × 10⁸, and 10.0 × 10⁸ of human platelets were 0.6% ± 0.3%, 2.0% ± 1.6%, and 10.3% ± 1.4%, respectively. n = 3 per group. Data are expressed as the mean ± SD. CD41-FITC: Cluster of differentiation 41-fluorescein isothiocyanate.
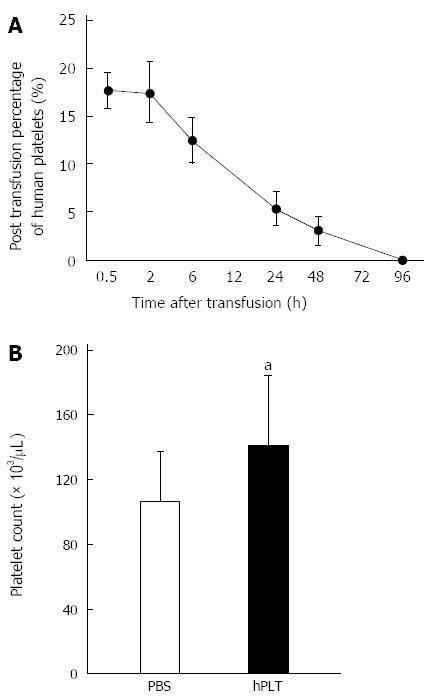
Figure 2 Post-transfusion percentages of human platelets and peripheral platelet counts.
A: The post-transfusion percentages of human platelets. Human platelets disappeared from the circulation at 96 h post-transfusion. n = 3 per group. Data are expressed as the mean ± SD; B: Peripheral platelet counts. The peripheral platelet count was significantly higher in the human platelet transfusions group than in the phosphate-buffered saline group. n = 8 per group. Data are expressed as the mean ± SD. aP < 0.05 using an unpaired t-test. PBS: Phosphate-buffered saline; hPLT: Human platelet transfusions.
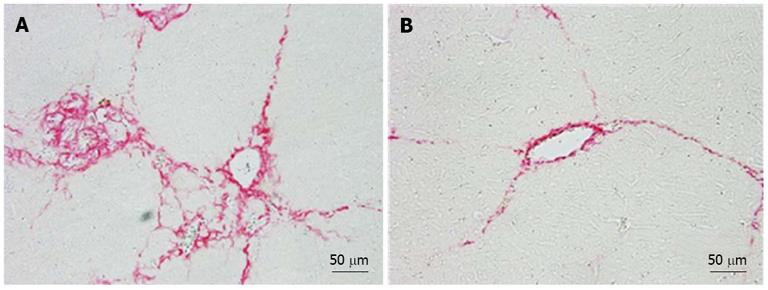
Figure 3 Fibrotic index and hydroxyproline contents.
A: The fibrotic index, which was calculated based on the area stained by picrosirius red solution, was significantly lower in the human platelet transfusions (hPLT group) group than in the phosphate-buffered saline (PBS) group; B: The hydroxyproline content in the liver tissue was significantly lower in the hPLT group than in the PBS group. n = 8 per group.
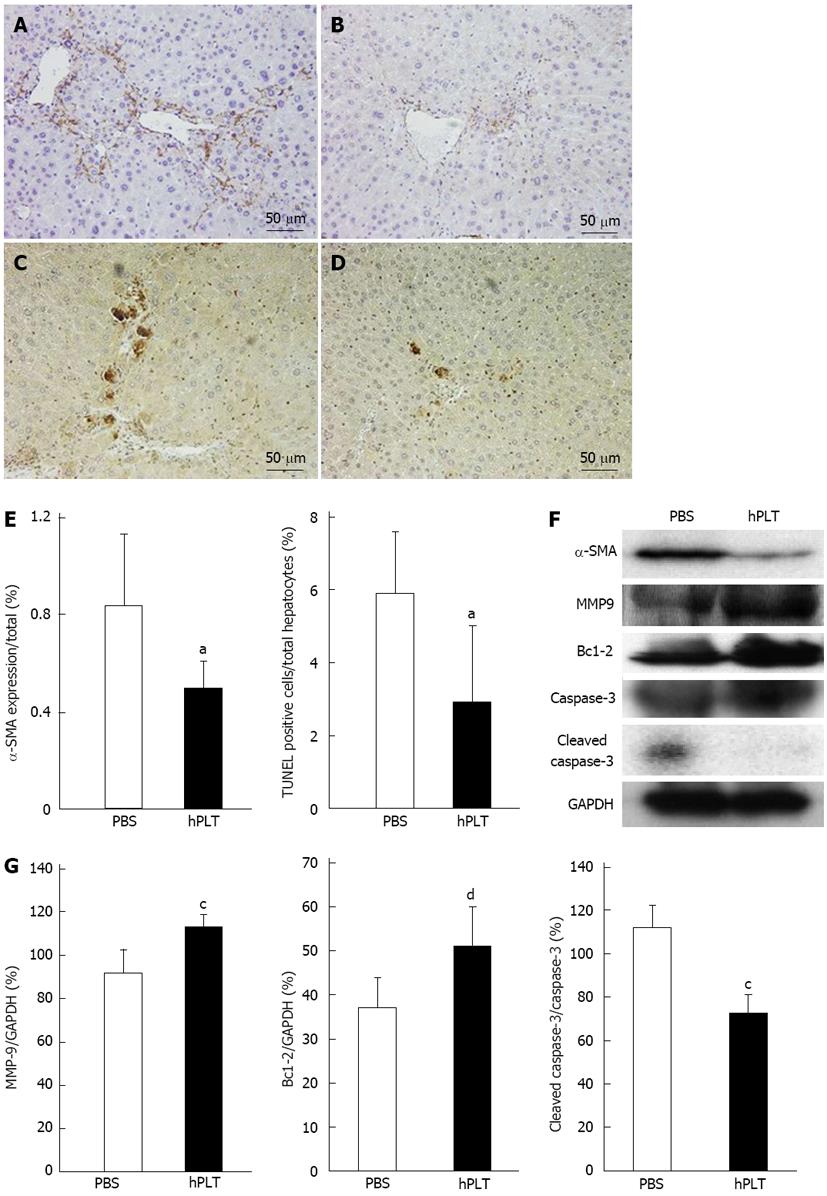
Figure 4 α-smooth muscle actin and TUNEL staining.
Matrix metalloproteinase-9 (MMP-9), Bcl-2, caspase-3, cleaved caspase-3 expression levels. A, B: Immunostaining of α-smooth muscle actin (α-SMA) in the phosphate-buffered saline (PBS group) or human platelet transfusions (hPLT group). The α-SMA staining was less robust in the hPLT group than in the PBS group; C, D: Terminal deoxynucleotidyl transferase dUTP nick end labeling (TUNEL) staining in the PBS and hPLT groups. Few apoptotic cells were observed in the hPLT group, whereas several apoptotic hepatocytes were observed in the PBS group; E: α-SMA expression calculated based on the area stained by anti-α-SMA antibody and TUNEL-positive hepatocytes/total hepatocytes in the PBS and hPLT groups. n = 6 per group. Data are expressed as the mean ± SD. aP < 0.05 using an unpaired t-test. α-SMA expression and the number of apoptotic hepatocytes in the hPLT group were lower than those in the PBS group; F: α-SMA, MMP-9, Bcl-2, caspase-3, and cleaved caspase-3 expression levels assessed with Western blotting. α-SMA and cleaved caspase-3 expression levels were less intense in the hPLT group than in the PBS group, whereas MMP-9 and Bcl-2 expression levels were stronger in the hPLT group than in the PBS group; G: MMP-9, Bcl-2, and cleaved caspase-3 expression levels were quantified using densitometry. n = 3 per group. Data are expressed as the means ± SD. cP < 0.05 and dP < 0.01 using an unpaired t-test. MMP-9 and Bcl-2 expression levels were significantly higher in the hPLT group than in the PBS group, whereas cleaved caspase-3 expression was significantly lower in the hPLT group than in the PBS group. Bcl-2: B-cell lymphoma-2.
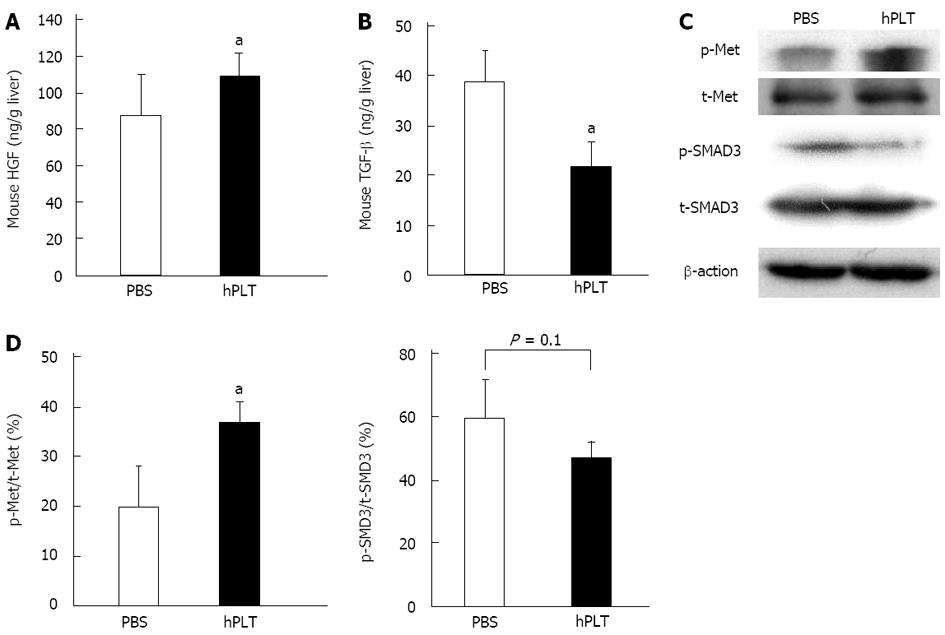
Figure 5 Mouse hepatocyte growth factor and transforming growth factor-β in liver tissue and cellular signal transductions.
A: Mouse hepatocyte growth factor (HGF) concentrations in liver tissue. n = 8 per group. Data are expressed as the means ± SD. aP < 0.05 for the human platelet transfusions (hPLT) group vs the phosphate-buffered saline (PBS) group using an unpaired t-test. Mouse HGF expression was significantly higher in the hPLT group than in the PBS group; B: Mouse transforming growth factor-β (TGF-β) concentrations in liver tissue. n = 8 per group. Data are expressed as the mean ± SD. aP < 0.05 using an unpaired t-test. Mouse TGF-β expression was significantly lower in the hPLT group than in the PBS group; C: Phosphorylation of mesenchymal-epithelial transition factor (Met) and SMAD3 in the PBS and hPLT groups. Met was more highly phosphorylated in the hPLT group than in the PBS group, whereas phosphorylation of SMAD3 was weaker in the hPLT group than in the PBS group; D: Met and SMAD3 phosphorylation levels were quantified using densitometry. n = 3 per group. Data are expressed as the mean ± SD. aP < 0.05 using an unpaired t-test. Phosphorylation of Met was significantly higher in the hPLT group than in the PBS group. Although the difference was not statistically significant, phosphorylation of SMAD3 tended to be lower in the hPLT group than in the PBS group.
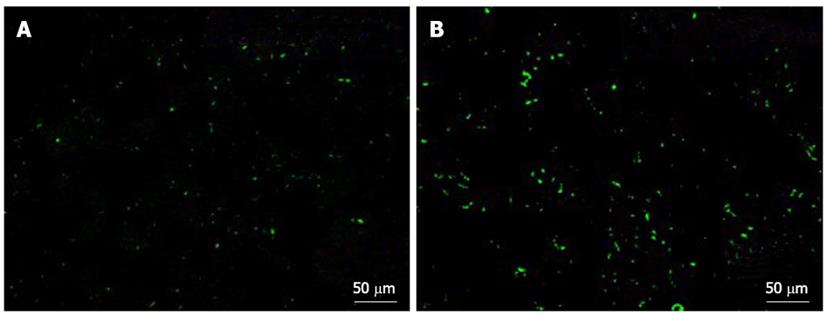
Figure 6 Accumulation of transfused human platelets in the liver.
A: Normal liver; B: Fibrotic liver. Immunostaining images obtained using anti-human CD41 antibody 2 h after transfusion. Significant human platelet accumulation in the liver was observed in the fibrotic liver, whereas few platelets accumulated in the normal liver.
- Citation: Takahashi K, Murata S, Fukunaga K, Ohkohchi N. Human platelets inhibit liver fibrosis in severe combined immunodeficiency mice. World J Gastroenterol 2013; 19(32): 5250-5260
- URL: https://www.wjgnet.com/1007-9327/full/v19/i32/5250.htm
- DOI: https://dx.doi.org/10.3748/wjg.v19.i32.5250


