Copyright
©2013 Baishideng Publishing Group Co.
World J Gastroenterol. Aug 7, 2013; 19(29): 4808-4817
Published online Aug 7, 2013. doi: 10.3748/wjg.v19.i29.4808
Published online Aug 7, 2013. doi: 10.3748/wjg.v19.i29.4808
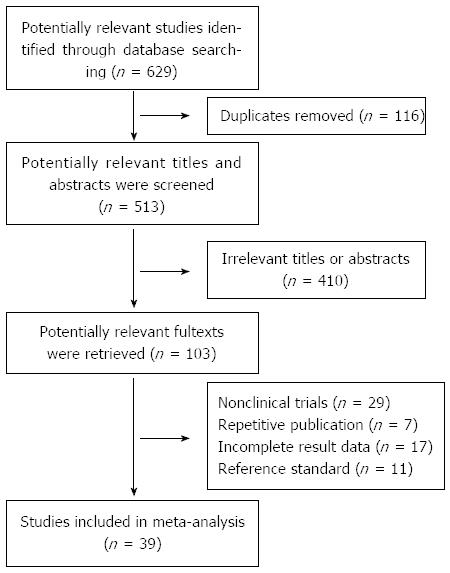
Figure 1 QUORUM flow chart for studies.
Figure 2 Methodological quality graph.
A: Diagnosis and staging studies; B: Prognosis studies. Authors’ judgments about each methodological quality item presented as percentages across all included studies.
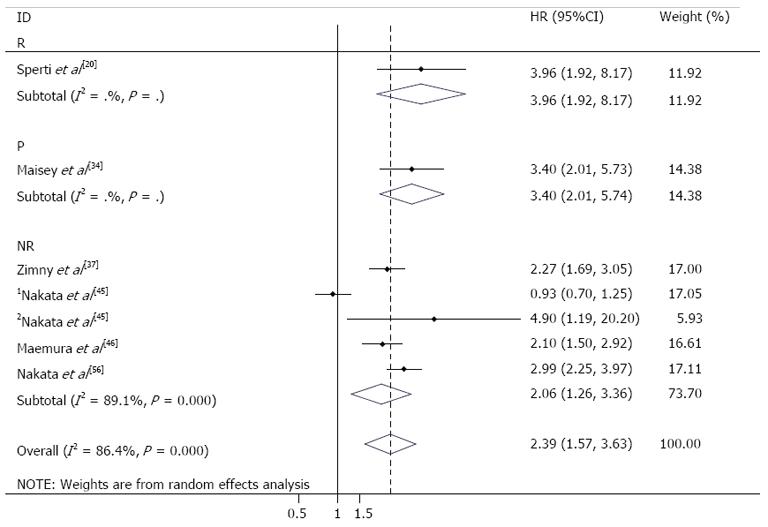
Figure 3 Forrest plot for the prognosis of pancreatic carcinoma.
1Patients received operation; 2Patients did not receive operation.
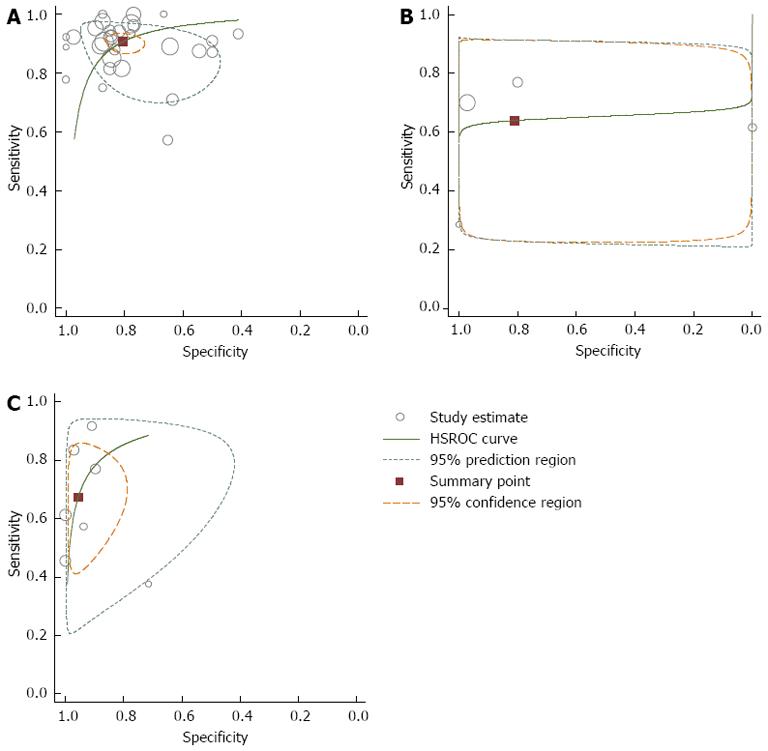
Figure 4 Hierarchical summary receiver operating characteristic curve.
A: For the diagnosis of pancreatic carcinoma; B: For N staging of pancreatic carcinoma; C: For liver metastasis of pancreatic carcinoma. HSROC: Hierarchical summary receiver operating characteristic.
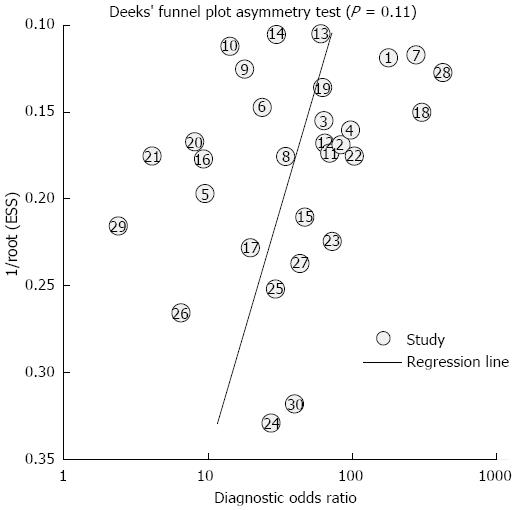
Figure 5 Funnel plot based on the data of positron emission tomography/ computed tomography for the diagnosis of pancreatic carcinoma.
- Citation: Wang Z, Chen JQ, Liu JL, Qin XG, Huang Y. FDG-PET in diagnosis, staging and prognosis of pancreatic carcinoma: A meta-analysis. World J Gastroenterol 2013; 19(29): 4808-4817
- URL: https://www.wjgnet.com/1007-9327/full/v19/i29/4808.htm
- DOI: https://dx.doi.org/10.3748/wjg.v19.i29.4808


