Copyright
©2013 Baishideng Publishing Group Co.
World J Gastroenterol. Aug 7, 2013; 19(29): 4774-4780
Published online Aug 7, 2013. doi: 10.3748/wjg.v19.i29.4774
Published online Aug 7, 2013. doi: 10.3748/wjg.v19.i29.4774
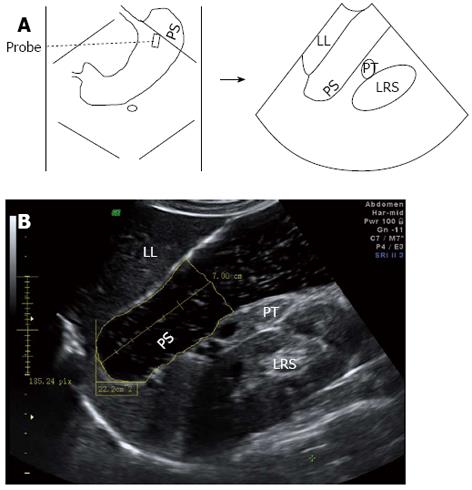
Figure 1 Sagittal section of the proximal stomach.
A: To obtain the section, a probe is placed longitudinally under the left subcostal margin and tilted cranially in the long axial direction of proximal stomach (PS) to show the top of gastric fundus, in which left renal sinus (LRS), left liver (LL), and pancreatic tail (PT) are simultaneously displayed; B: Proximal gastric area (PGA) is measured by means of outlining along the echogenic mucosa surface of PS in the distance between the echoic inner surface of the fundus top down to 7 cm level (between cursors).
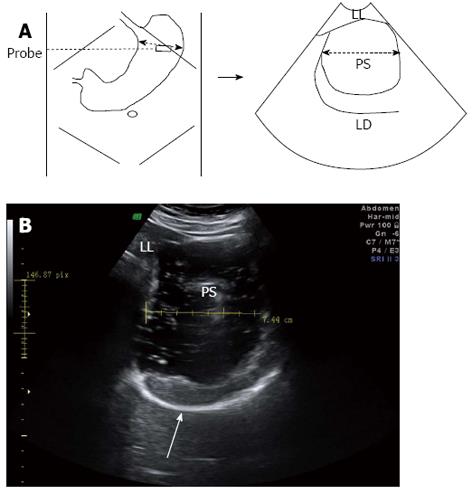
Figure 2 Maximal transverse section of the proximal stomach.
A: After acquiring the previous sagittal section, the probe is rotated about 90° to show the maximal transverse diameter (dotted line with double arrow), in which the left diaphragm (LD) and left liver (LL) are simultaneously depicted; B: In measuring maximal proximal gastric diameter, the cursors are placed on the echogenic mucosal surfaces of the lesser and greater curvatures. LL and the arrow indicate left liver and left diaphragm, respectively. PS: Proximal stomach.
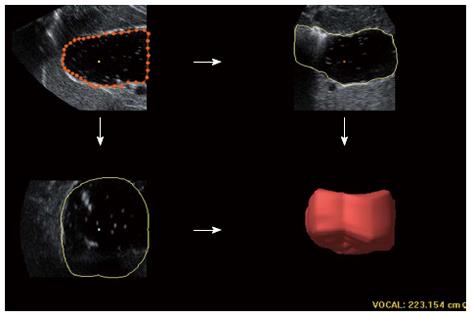
Figure 3 Three-dimensional ultrasound applied for measuring proximal gastric volume.
The volume is measured similarly from the top inner margin of the fundus to 7 cm level inferiorly along the long axis of proximal stomach; six sections of the block from six 30° rotations are separately outlined along the echoic interface in the upper left view. A reconstructive volume is displayed in the lower right view.
- Citation: Fan XP, Wang L, Zhu Q, Ma T, Xia CX, Zhou YJ. Sonographic evaluation of proximal gastric accommodation in patients with functional dyspepsia. World J Gastroenterol 2013; 19(29): 4774-4780
- URL: https://www.wjgnet.com/1007-9327/full/v19/i29/4774.htm
- DOI: https://dx.doi.org/10.3748/wjg.v19.i29.4774


