Copyright
©2013 Baishideng Publishing Group Co.
World J Gastroenterol. Aug 7, 2013; 19(29): 4702-4717
Published online Aug 7, 2013. doi: 10.3748/wjg.v19.i29.4702
Published online Aug 7, 2013. doi: 10.3748/wjg.v19.i29.4702
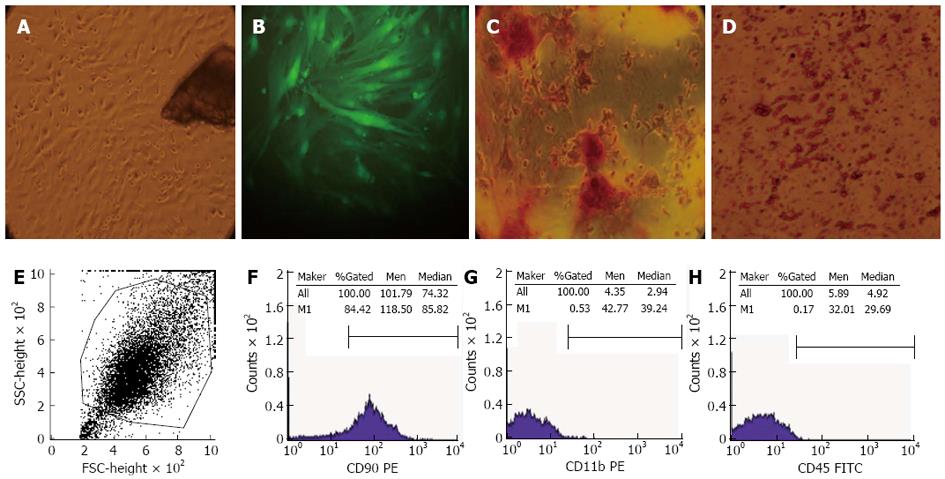
Figure 1 Morphological features, immunophenotypic characterization and differentiation assays of compact bone-derived mouse mesenchymal stem cells.
A: At 72 h after initial culture, the cells migrate out from the enzyme-digested bone chips (× 100); B: Green fluorescent protein -bone marrow mesenchymal stem cells (BMSCs) arranged in a bunched or radiated shape without weakening of the green fluorescence after passages (× 400); C: Osteoplastic differentiation of BMSCs (× 400); D: Apoplastic differentiation of BMSCs (× 400); E-H: BMSCs’ phenotypes detected by flow cytometry.
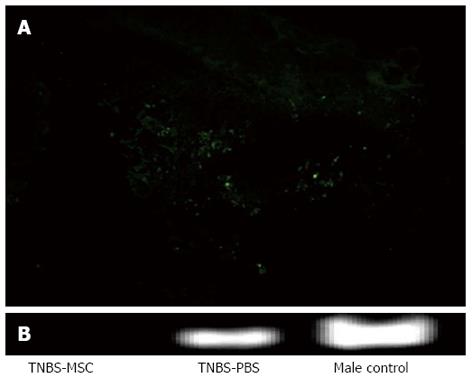
Figure 2 Localization of transplanted green fluorescent protein-bone marrow mesenchymal stem cells.
A: Fluorescence in the lamina propria of colon using fluorescence microscopy (× 100); B: Sry gene expression (1188 bp)in the colons of 3 groups by polymerase chain reaction. TNBS-MSC: Trinitrobenzene sulfonic acid-mesenchymal stem cells; TNBS-PBS: Trinitrobenzene sulfonic acid-phosphate-buffered saline.
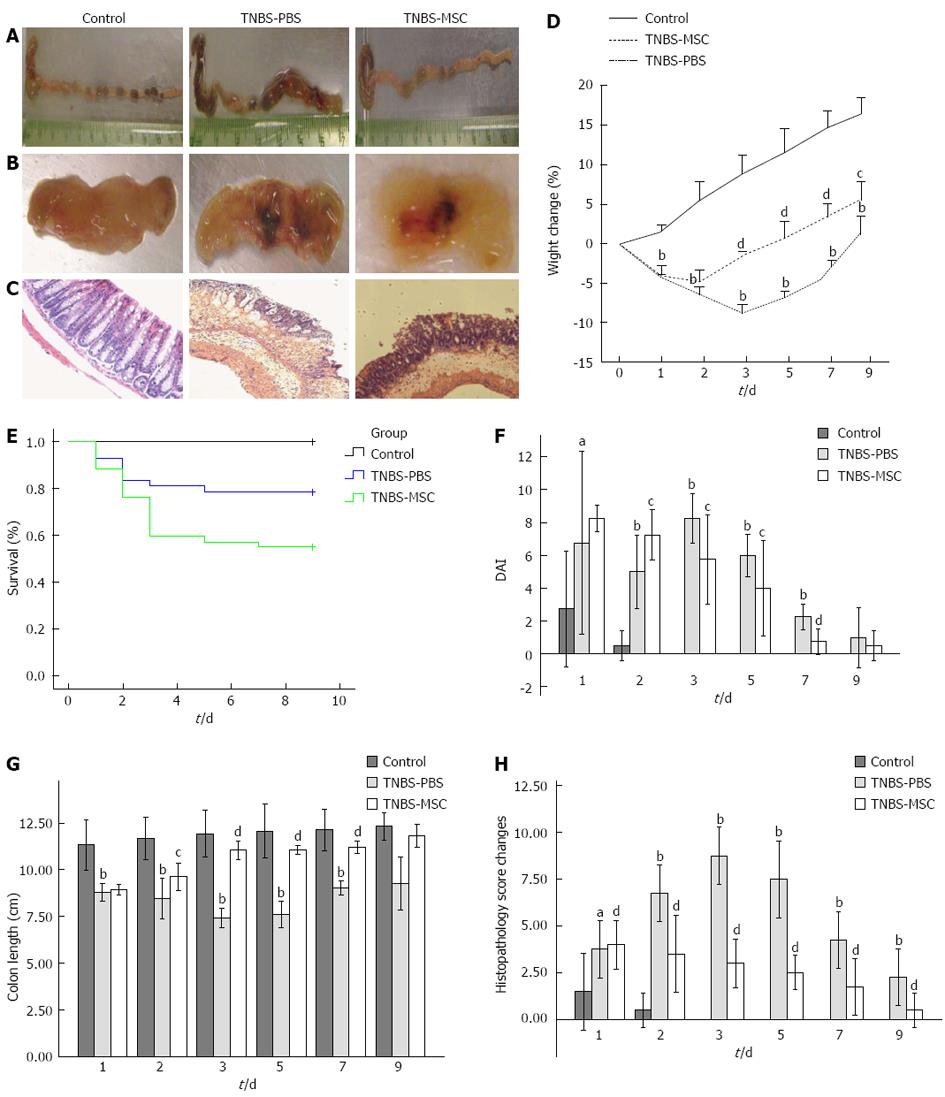
Figure 3 Therapeutic efficacy of bone marrow mesenchymal stem cells treatment.
A: Colon length at day 3; B: Macroscopic colonic damage at day 3; C: Histopathologic colonic damage by hematoxylin and eosin staining at day 3 (× 100); D-F: Clinical evolutions were monitored by body weight changes, colitis score and survival; G) Colon length changes; H: Histopathology score changes. aP < 0.05, bP < 0.01 vs control; cP < 0.05, dP < 0.01 vs TNBS-PBS. TNBS-MSC: Trinitrobenzene sulfonic acid-mesenchymal stem cells; TNBS-PBS: Trinitrobenzene sulfonic acid-phosphate-buffered saline.
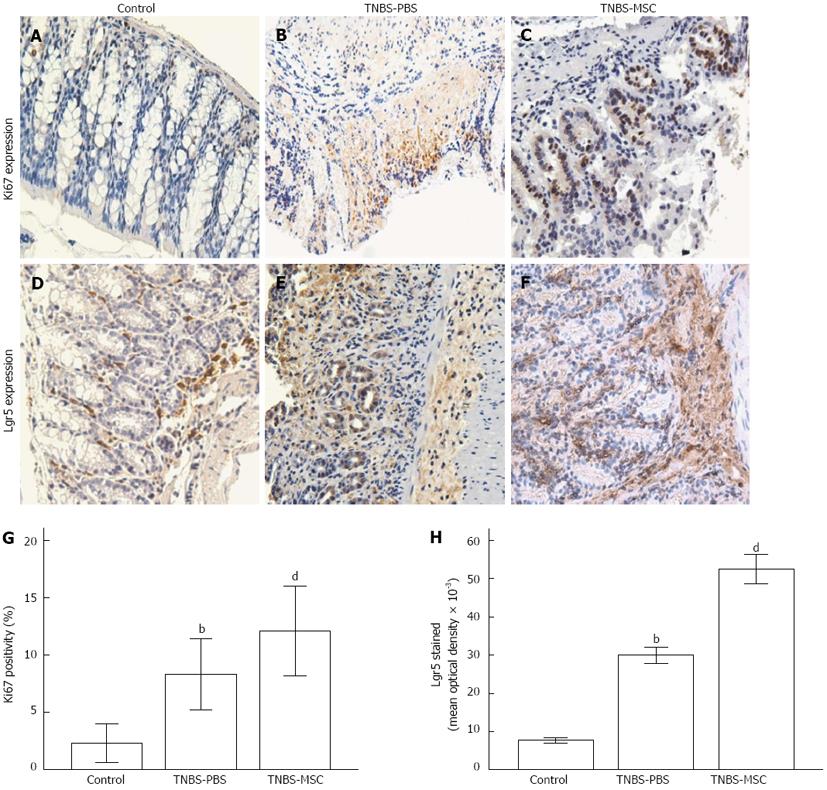
Figure 4 Immunohistochemistry of Ki67 and Lgr5 in colon tissues (× 200).
A-C: Ki67; D-F: Lgr5; G, H: Five days after MSCs transplantation, Ki67 and Lgr5 expressions were significantly increased (vs control, bP < 0.01; vs TNBS-PBS, dP < 0.01). Ki67 staining was evaluated by positivity, and Lgr5 expression was represented by mean optical density. TNBS-MSC: Trinitrobenzene sulfonic acid-mesenchymal stem cells; TNBS-PBS: Trinitrobenzene sulfonic acid-phosphate-buffered saline.
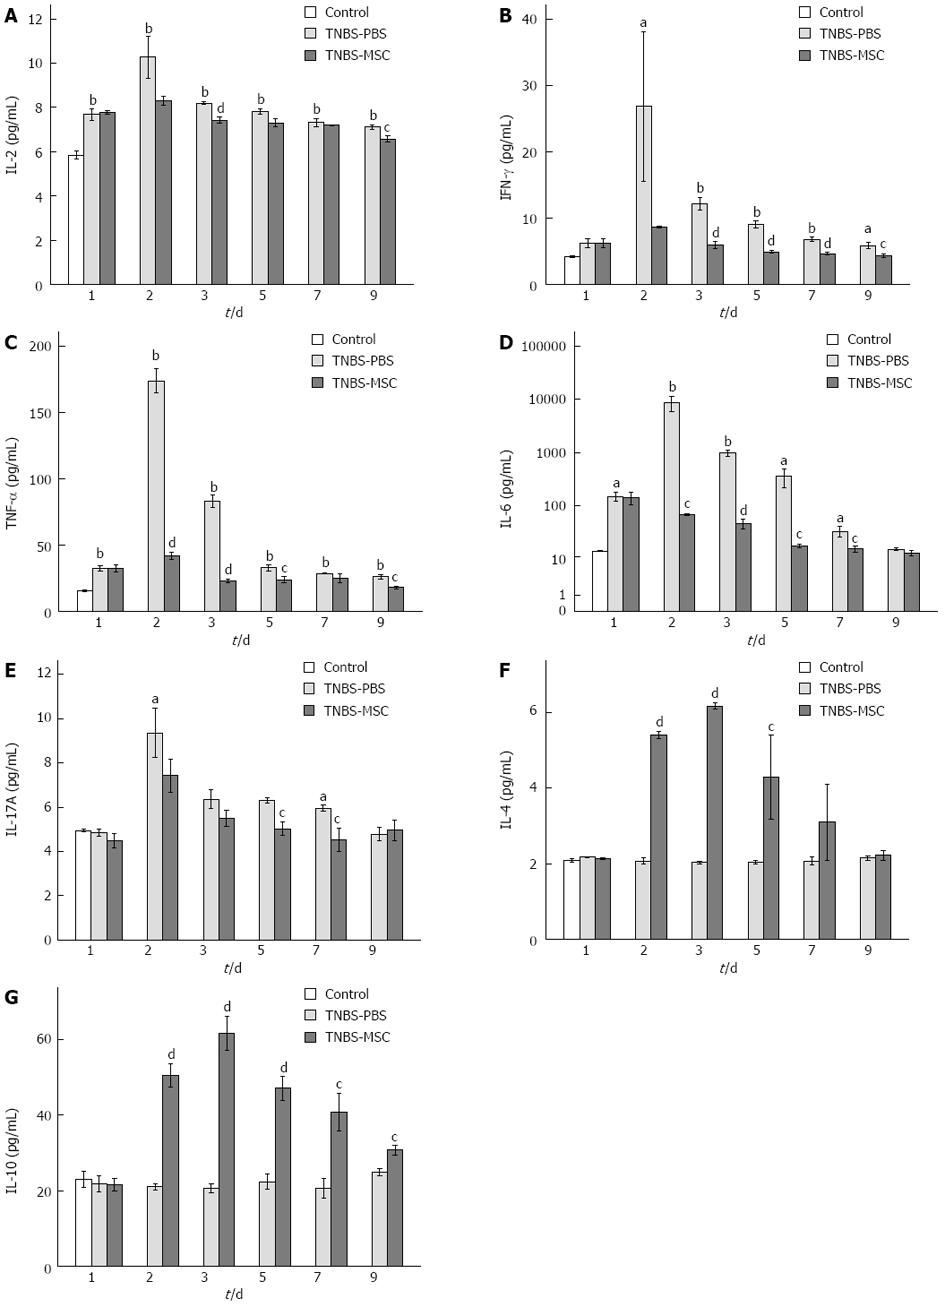
Figure 5 Levels of 7 cytokines were measured simultaneously from mouse serum using Fluorescence Activated Cell Sorting.
A-E: TNBS-induced colitis exhibits heightened Th1-Th17 response of a complex, dynamic cytokine network [interleukin (IL)-2, tumor necrosis factor (TNF)-α, interferon (IFN)-γ, IL-6, IL-17], and MSCs maintain the balance of T-lymphocytes. F, G: In the TNBS-MSC group, transplanted MSCs promote T-lymphocytes to secrete cytokines (IL-4, IL-10) which regulate their functions. aP < 0.05, bP < 0.01 vs control; cP < 0.05, dP < 0.01 vs TNBS-PBS. TNBS-MSC: Trinitrobenzene sulfonic acid-mesenchymal stem cells; TNBS-PBS: Trinitrobenzene sulfonic acid-phosphate-buffered saline.
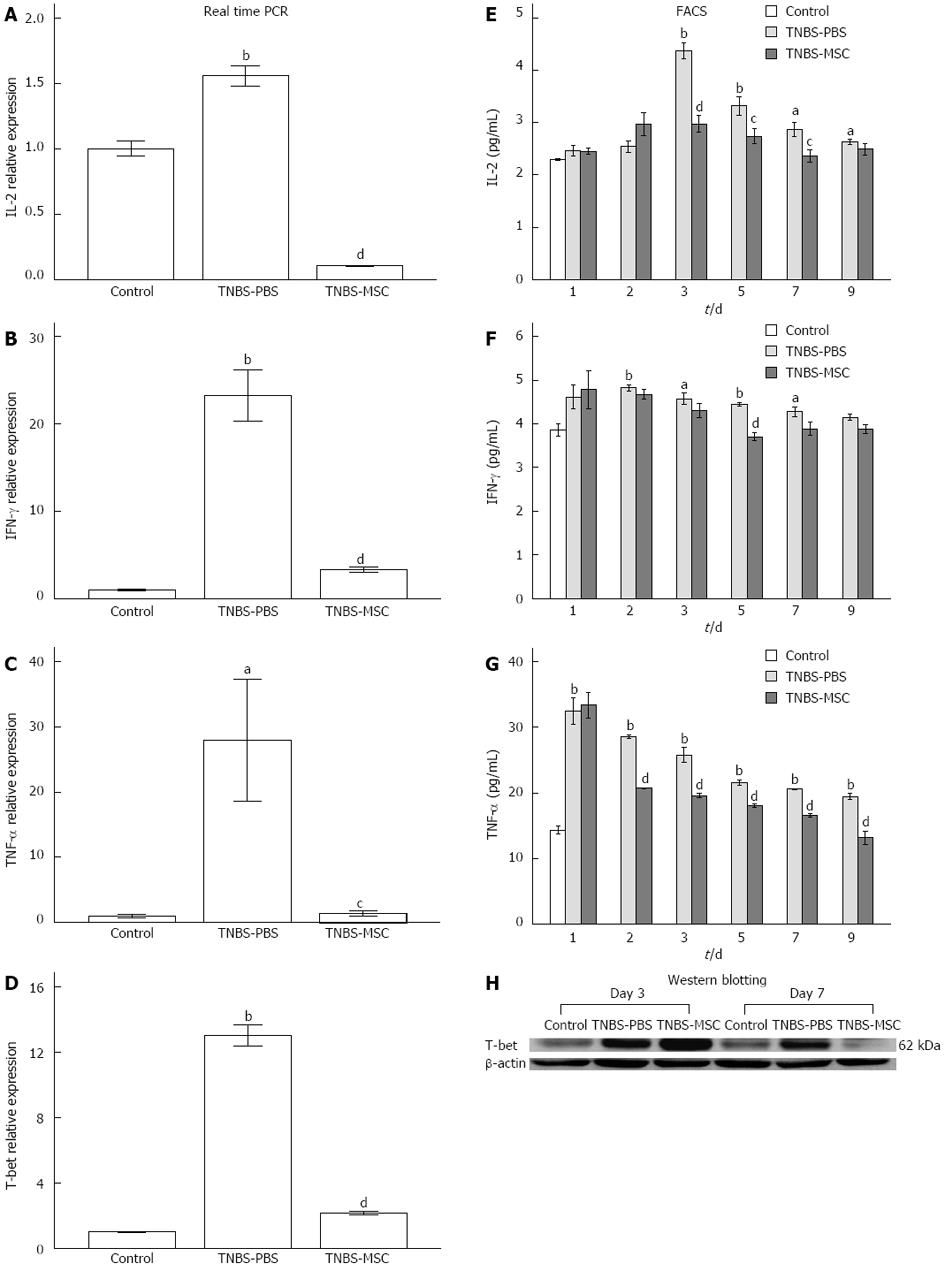
Figure 6 Changes in mRNA expression and colonic protein levels of Th1-related inflammatory mediators following treatment with bone marrow mesenchymal stem cells.
A-D: Real-time polymerase chain reaction. Acute TNBS colitis demonstrated a cytotoxic and chemotactic profile with significantly elevated mRNA expressions of interleukin (IL)-2, interferon (IFN)-γ, tumor necrosis factor (TNF)-α and T-bet when compared to controls. Preventive treatment with BMSCs reduced the levels of the above cytokines; E-G: Flow cytometry. The changes in colonic protein levels of IL-2, IFN-γ and TNF-α followed the same trend; H: Western blotting. The changes in colonic protein levels of T-bet followed the same trend. aP < 0.05, bP < 0.01 vs control; cP < 0.05, dP < 0.01 vs TNBS-PBS. TNBS-MSC: Trinitrobenzene sulfonic acid-mesenchymal stem cells; TNBS-PBS: Trinitrobenzene sulfonic acid-phosphate-buffered saline.
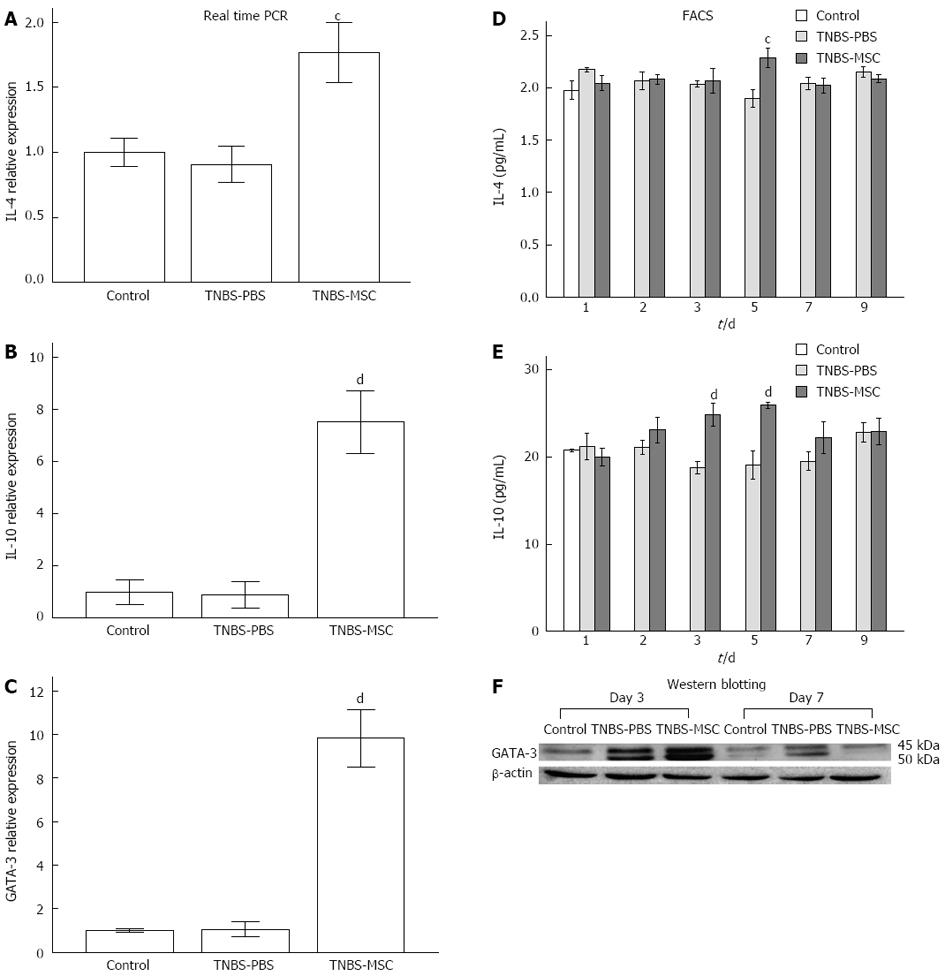
Figure 7 Changes in mRNA expression and colonic protein levels of Th2-related inflammatory mediators following treatment with bone marrow mesenchymal stem cells.
A-C: Real-time polymerase chain reaction. No significant differences in mRNA expressions of interleukin (IL)-4, IL-10 and GATA family of transcription factors 3 (GATA-3) were observed when compared to controls (P > 0.05). After treatment with bone marrow mesenchymal stem cells, the mRNA expressions of IL-4, IL-10 and GATA-3 were elevated. D, E: Flow cytometry. Colonic protein levels of IL-4 and IL-10 followed the same trend; F: Western blotting. Colonic protein level of GATA-3 followed the same trend. aP < 0.05, bP < 0.01 vs control; cP < 0.05, dP < 0.01 vs TNBS-PBS. TNBS-MSC: Trinitrobenzene sulfonic acid-mesenchymal stem cells; TNBS-PBS: Trinitrobenzene sulfonic acid-phosphate-buffered saline.
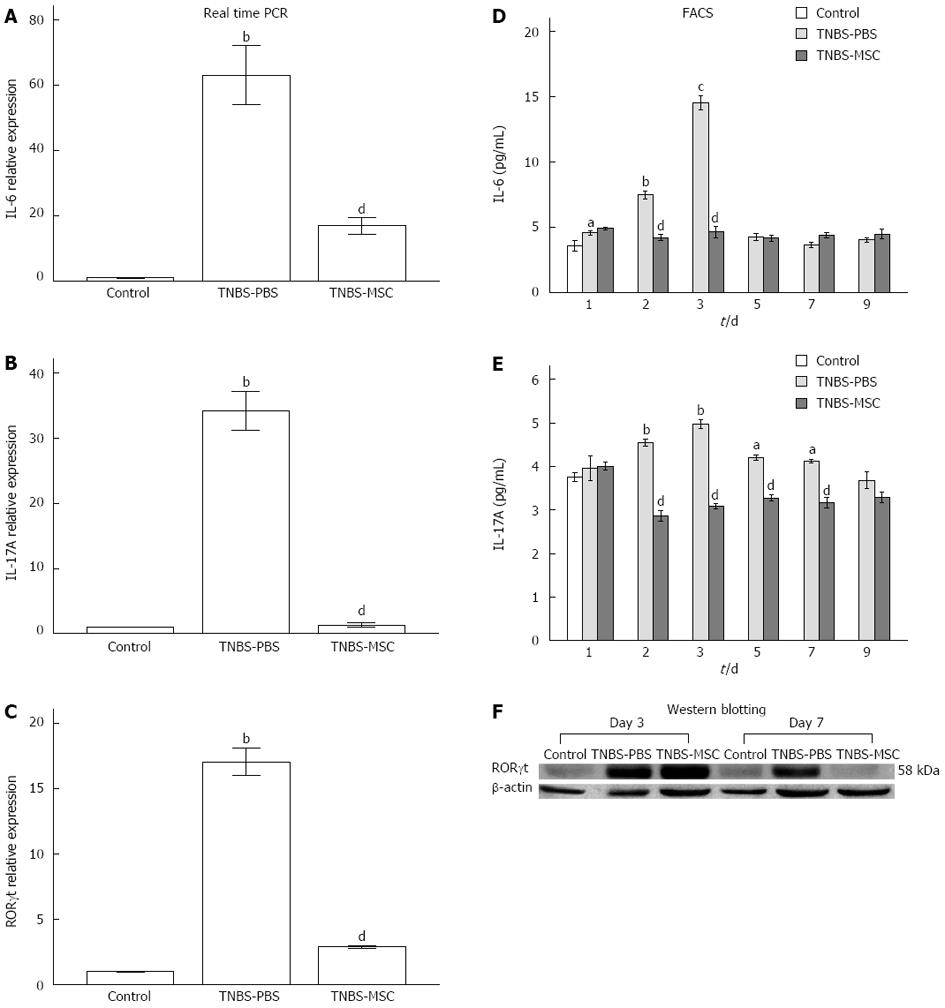
Figure 8 Changes in mRNA expression and colonic protein levels of Th17-related inflammatory mediators following treatment with bone marrow mesenchymal stem cells.
A-C: Real-time polymerase chain reaction. The results showed a significant increase in mRNA expressions of interleukin (IL)-6, IL-17A and retinoid related orphan receptor gamma(t) (RORγt) when compared to controls (P < 0.01). After treatment with bone marrow mesenchymal stem cells, the levels of the above cytokines were reduced (P < 0.01); D, E: Flow cytometry. The same changes in colonic protein levels of IL-6 and IL-17A were further confirmed; F: Western blotting. The same changes in colonic protein levels of RORγt were further confirmed. aP < 0.05, bP < 0.01 vs control; cP < 0.05, dP < 0.01 vs TNBS-PBS. TNBS-MSC: Trinitrobenzene sulfonic acid-mesenchymal stem cells; TNBS-PBS: Trinitrobenzene sulfonic acid-phosphate-buffered saline.
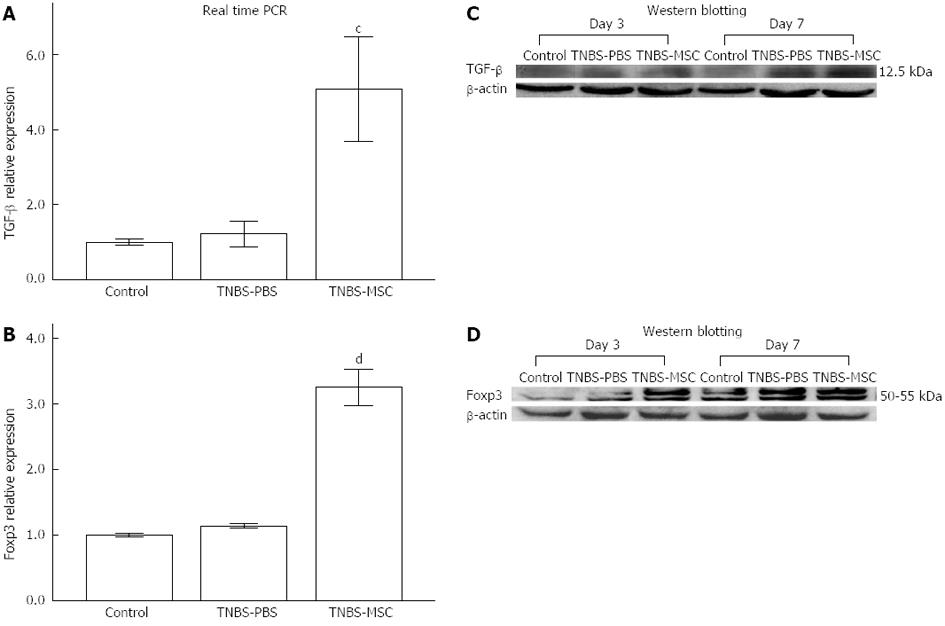
Figure 9 Changes in mRNA expression and colonic protein levels of Tregs-related inflammatory mediators following treatment with bone marrow mesenchymal stem cells.
A, B: Real-time polymerase chain reaction. No significant changes in mRNA expressions of transforming growth factor (TGF)-β and Foxp3 were observed when compared to controls (P > 0.05). While the mRNA expressions of TGF-β and Foxp3 increased after BMSCs transplantation (P < 0.01); C, D: Western blotting. The colonic protein level of TGF-β and Foxp3 were confirmed to show the same results as real-time polymerase chain reaction. cP < 0.05, dP < 0.01 vs TNBS-PBS. TNBS-MSC: Trinitrobenzene sulfonic acid-mesenchymal stem cells; TNBS-PBS: Trinitrobenzene sulfonic acid-phosphate-buffered saline.
- Citation: Chen QQ, Yan L, Wang CZ, Wang WH, Shi H, Su BB, Zeng QH, Du HT, Wan J. Mesenchymal stem cells alleviate TNBS-induced colitis by modulating inflammatory and autoimmune responses. World J Gastroenterol 2013; 19(29): 4702-4717
- URL: https://www.wjgnet.com/1007-9327/full/v19/i29/4702.htm
- DOI: https://dx.doi.org/10.3748/wjg.v19.i29.4702


