Copyright
©2013 Baishideng Publishing Group Co.
World J Gastroenterol. Jul 21, 2013; 19(27): 4363-4373
Published online Jul 21, 2013. doi: 10.3748/wjg.v19.i27.4363
Published online Jul 21, 2013. doi: 10.3748/wjg.v19.i27.4363
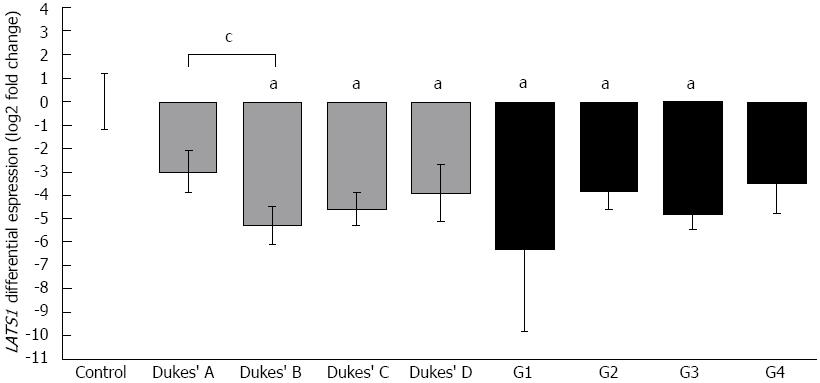
Figure 1 Large tumor suppressor 1 mRNA levels in colorectal cancer and control colon biopsies.
Quantitative polymerase chain reaction results of large tumor suppressor 1 (LATS1) expression in 142 colorectal cancer (CRC) samples compared with 40 colon biopsies of healthy patients. CRC cases were divided according to clinicopathological data: tumor stage - Dukes’ A (n = 27), B (n = 41), C (n = 54), D (n = 20); histological differentiation of tumor cells (G staging): G1 (n = 3), G2 (n = 48), G3 (n = 88), G4 (n = 3). Vertical bars represent LATS1 fold ratio calibrated to the average Ct of control (ΔΔCtLATS1 = ΔCtLATS1, sample - ΔCtLATS1, control), error bars: SE. aP < 0.05 vs control group; cP < 0.05 between subgroups (Mann-Whitney U test).
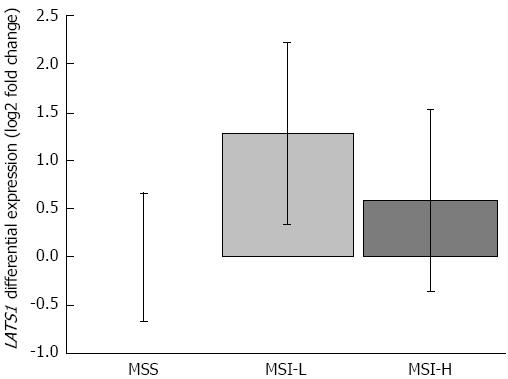
Figure 2 Microsatellite instability status and large tumor suppressor 1 expression.
Comparison of large tumor suppressor 1 (LATS1) mRNA levels in cases divided by the mutations observed in the BAT26, BAT25, and BAT40 microsatellite markers. Samples were considered to have microsatellite stability (MSS; no mutation), microsatellite instability-low grade (MSI-L; 1-2 mutations, light grey box), and microsatellite instability-high grade (MSI-H; mutations in all three markers, dark grey box). MSS (n = 40), MSI-L (n = 30), MSI-H (n = 14). Vertical bars represent LATS1 fold ratio calibrated to the average Ct of MSS cases - (ΔΔCtLATS1 = ΔCtLATS1, MSI - ΔCtLATS1, MSS), error bars: SE.
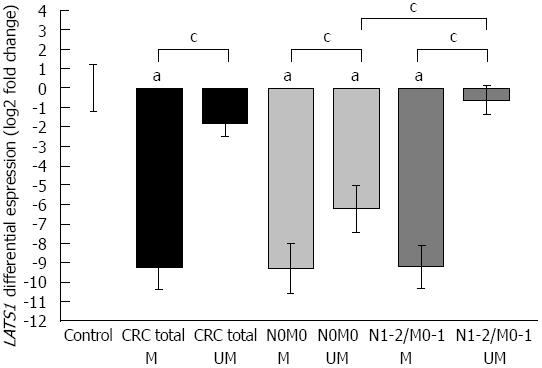
Figure 3 Large tumor suppressor 1 expression in colorectal cancer in relation to promoter methylation status.
Comparison between large tumor suppressor 1 (LATS1) mRNA expression and epigenetic hypermethylation (M) or absence of hypermethylation (UM) of CpG islands located within the LATS1 promoter region in a total of 44 colorectal cancer (CRC) cases (black vertical bars, n = 25 for M and n = 19 for UM). Vertical bars represent the LATS1 fold ratio calibrated to the average Ct of control (ΔΔCtLATS1 = ΔCtLATS1, sample - ΔCtLATS1, control), error bars: SE. CRC cases were further divided into two subgroups: absence or presence of metastasis in lymph nodes/distant organs: N0M0: Light grey bars (n = 20; M: n = 9; UM: n = 11); N1-2/M0-1: Dark bars (n = 24; M: n = 16; UM: n = 8), respectively. aP < 0.05 vs control group; cP < 0.05 between subgroups (Mann-Whitney U test).
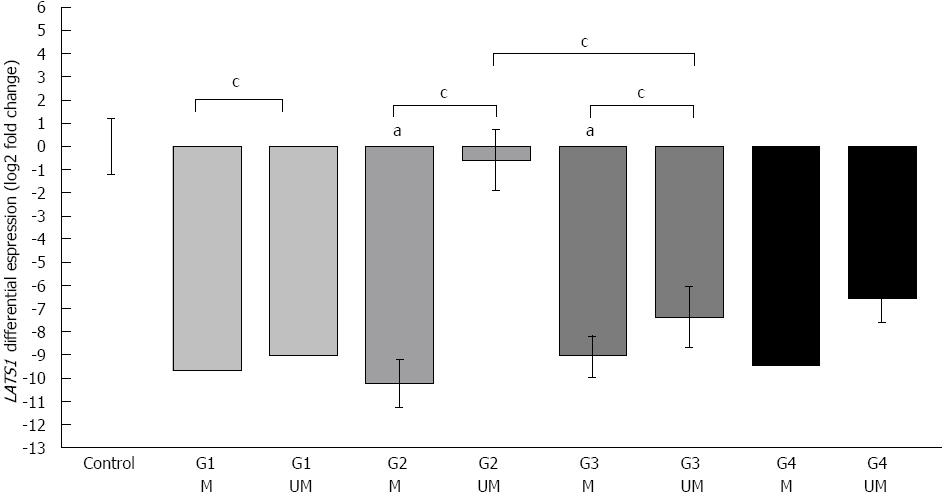
Figure 4 Methylation status of large tumor suppressor 1 in relation to the expression ratio and histological staging of cells.
Forty-four colorectal cancer cases were classified according to histological examination: G1: Well-differentiated cells, n = 2 (light grey bars), G2: Moderately differentiated cells, n = 11 (grey bars), G3: Poorly differentiated cells, n = 28 (dark grey bars), G4: Undifferentiated cells, n = 3 (black bars). G1 epigenetic hypermethylation (M) (n = 1), G1 absence of hypermethylation (UM) (n = 1), G2 M (n = 3), G2 UM (n = 8), G3 M (n = 20), G3 UM (n = 8), G4 M (n = 1), G4 UM (n = 2). Vertical bars represent the large tumor suppressor 1 (LATS1) fold ratio calibrated to the average Ct of control (ΔΔCtLATS1 = ΔCtLATS1, sample - ΔCtLATS1, control), error bars: SE. aP < 0.05 vs control group; cP < 0.05 between subgroups (Mann-Whitney U test).
-
Citation: Wierzbicki PM, Adrych K, Kartanowicz D, Stanislawowski M, Kowalczyk A, Godlewski J, Skwierz-Bogdanska I, Celinski K, Gach T, Kulig J, Korybalski B, Kmiec Z. Underexpression of
LATS1 TSG in colorectal cancer is associated with promoter hypermethylation. World J Gastroenterol 2013; 19(27): 4363-4373 - URL: https://www.wjgnet.com/1007-9327/full/v19/i27/4363.htm
- DOI: https://dx.doi.org/10.3748/wjg.v19.i27.4363


