Copyright
©2013 Baishideng Publishing Group Co.
World J Gastroenterol. Jul 7, 2013; 19(25): 3980-3989
Published online Jul 7, 2013. doi: 10.3748/wjg.v19.i25.3980
Published online Jul 7, 2013. doi: 10.3748/wjg.v19.i25.3980
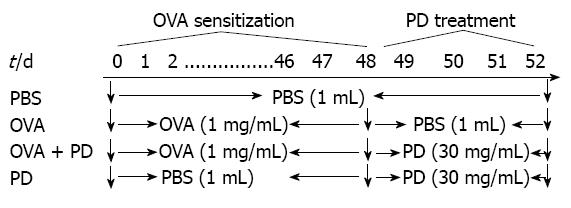
Figure 1 Protocol of ovalbumin sensitization/challenge and Formula-3 treatment.
Rats were sensitized with ovalbumin (OVA) (1 mg/mL × 1 mL daily per rat) intragastrically for 48 d. For the polydatin (PD) treatment group, the rats were orally treated with PD (30 mg/mL × 1 mL daily per rat) from days 49 to 52 after OVA sensitization. All the rat groups were challenged by 100 mg/mL OVA for 24 h at the end of day 52 and then sacrificed. PBS: Phosphate-buffered saline.
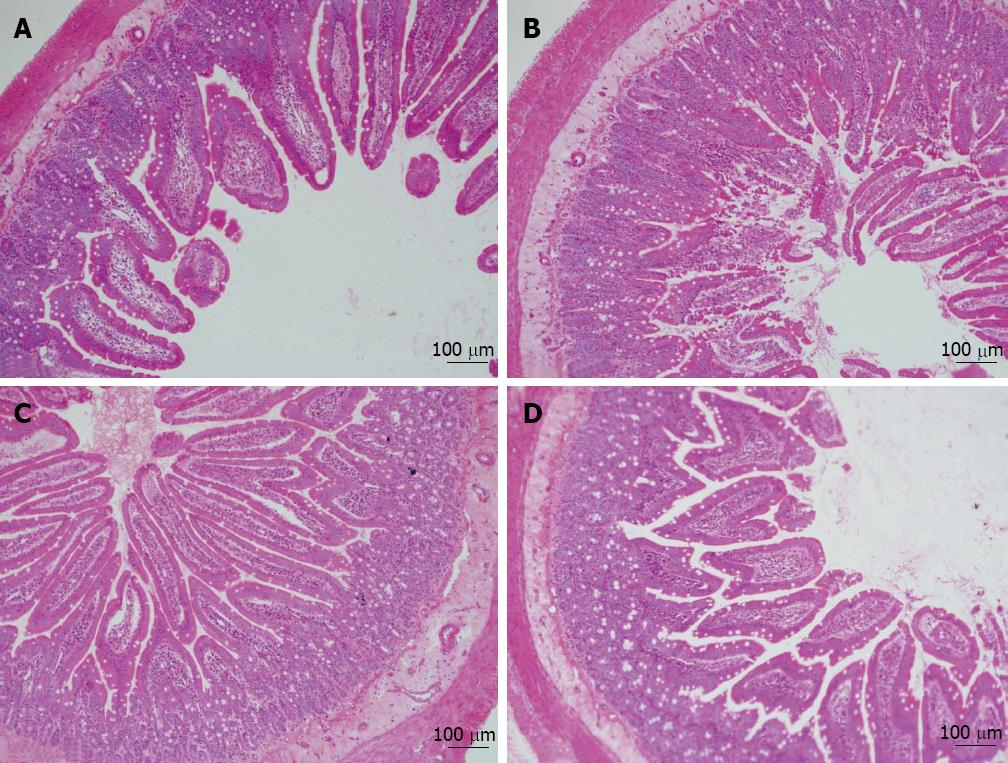
Figure 2 Polydatin attenuated tissue injury in small intestine caused by ovalbumin sensitization.
A: Phosphate-buffered saline group; B: Ovalbumin (OVA) group; C: OVA + polydatin (PD) group; D: PD group. Morphology of intestinal jejunum was analyzed by hematoxylin and eosin staining. Representative images from three independent experiments are shown (magnification, × 63).
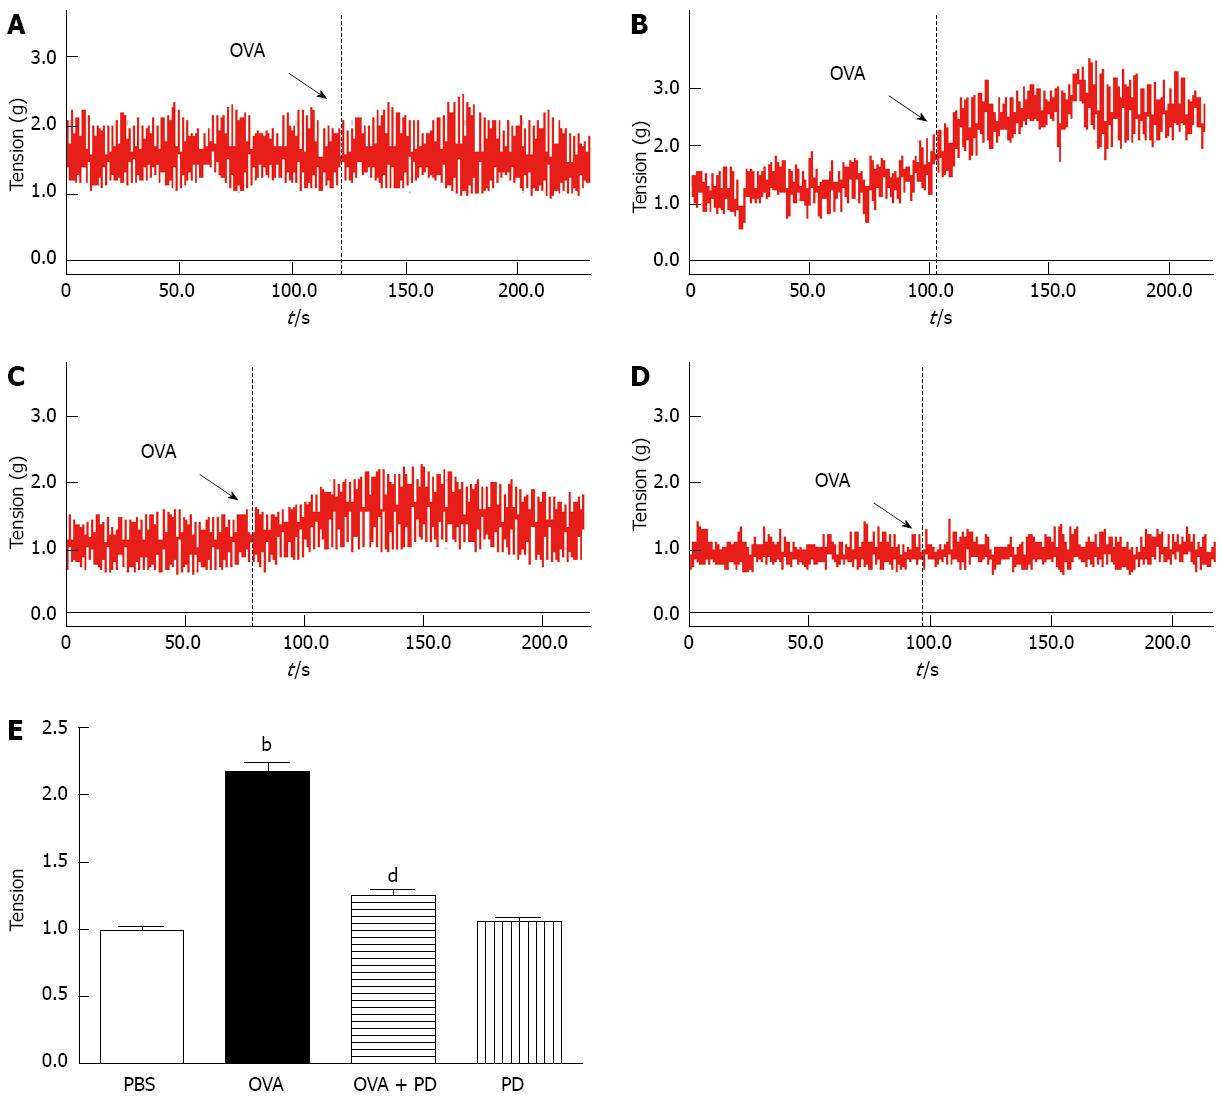
Figure 3 Polydatin attenuated small intestinal hyperreactivity in ovalbumin-allergic rats.
A: Phosphate-buffered saline (PBS) group; B: Ovalbumin (OVA) group; C: OVA + polydatin (PD) group; D: PD group. n = 8, bP < 0.01 vs PBS group; dP < 0.01 vs OVA group. The tension of intestinal mobility was measured by smooth muscle organ bath, typical contraction curves (A-D), and the peak tension of each group (E).
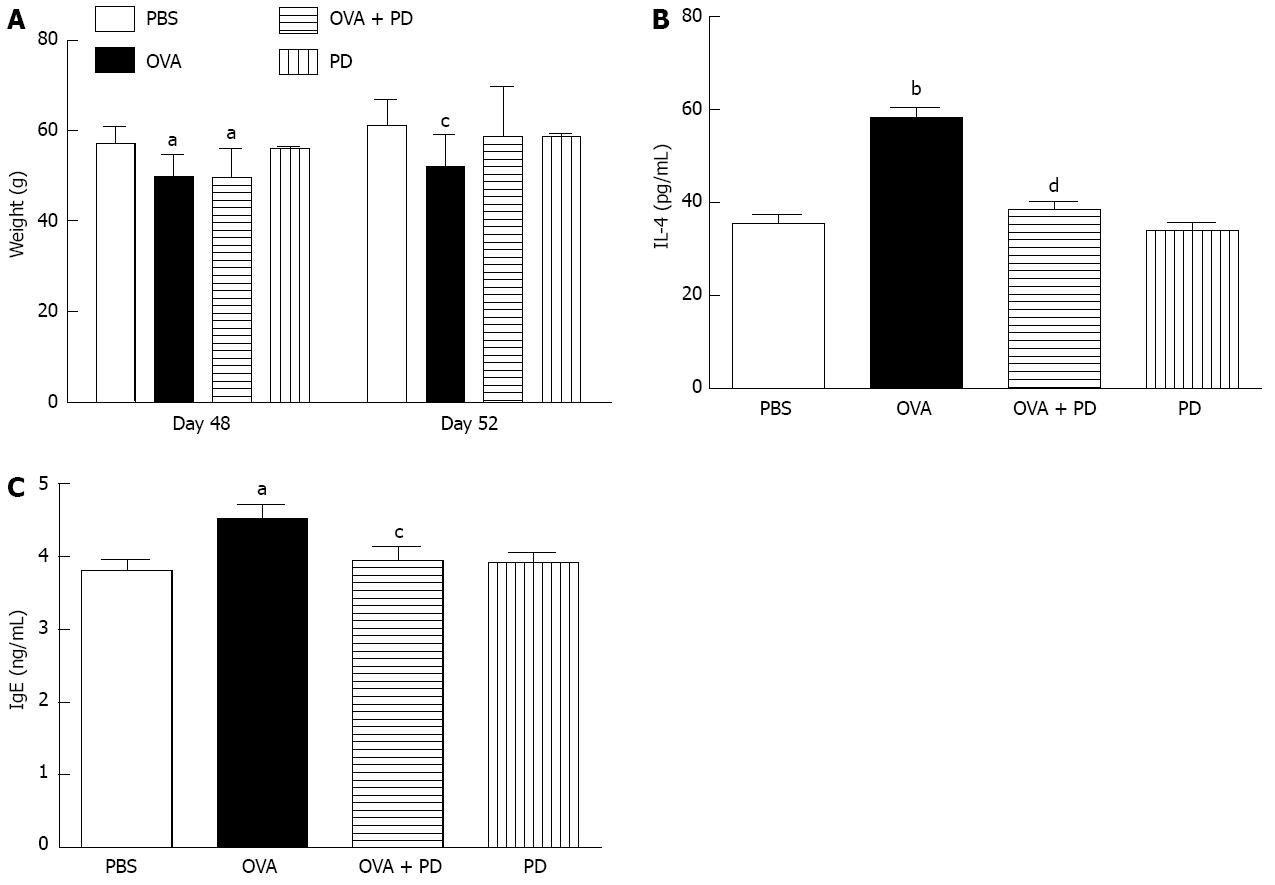
Figure 4 Polydatin suppressed interleukin-4 release and immunoglobulin E production in ovalbumin-allergic rats.
A: Body weight of rats on day 48 [left panel, before polydatin (PD) treatment] or day 52 (right panel, after PD treatment) are shown; B: The cytokine levels in rat small intestine tissue or peritoneal lavage solution were analyzed by enzyme-linked immunosorbent assay; C: Statistical analysis of ovalbumin (OVA)-specific immunoglobulin E (IgE) in serum, which were collected from allergic rats administered with or without PD. n = 8. aP < 0.05, bP < 0.01 vs phosphate-buffered saline (PBS) group; cP < 0.05, dP < 0.01 vs OVA group.
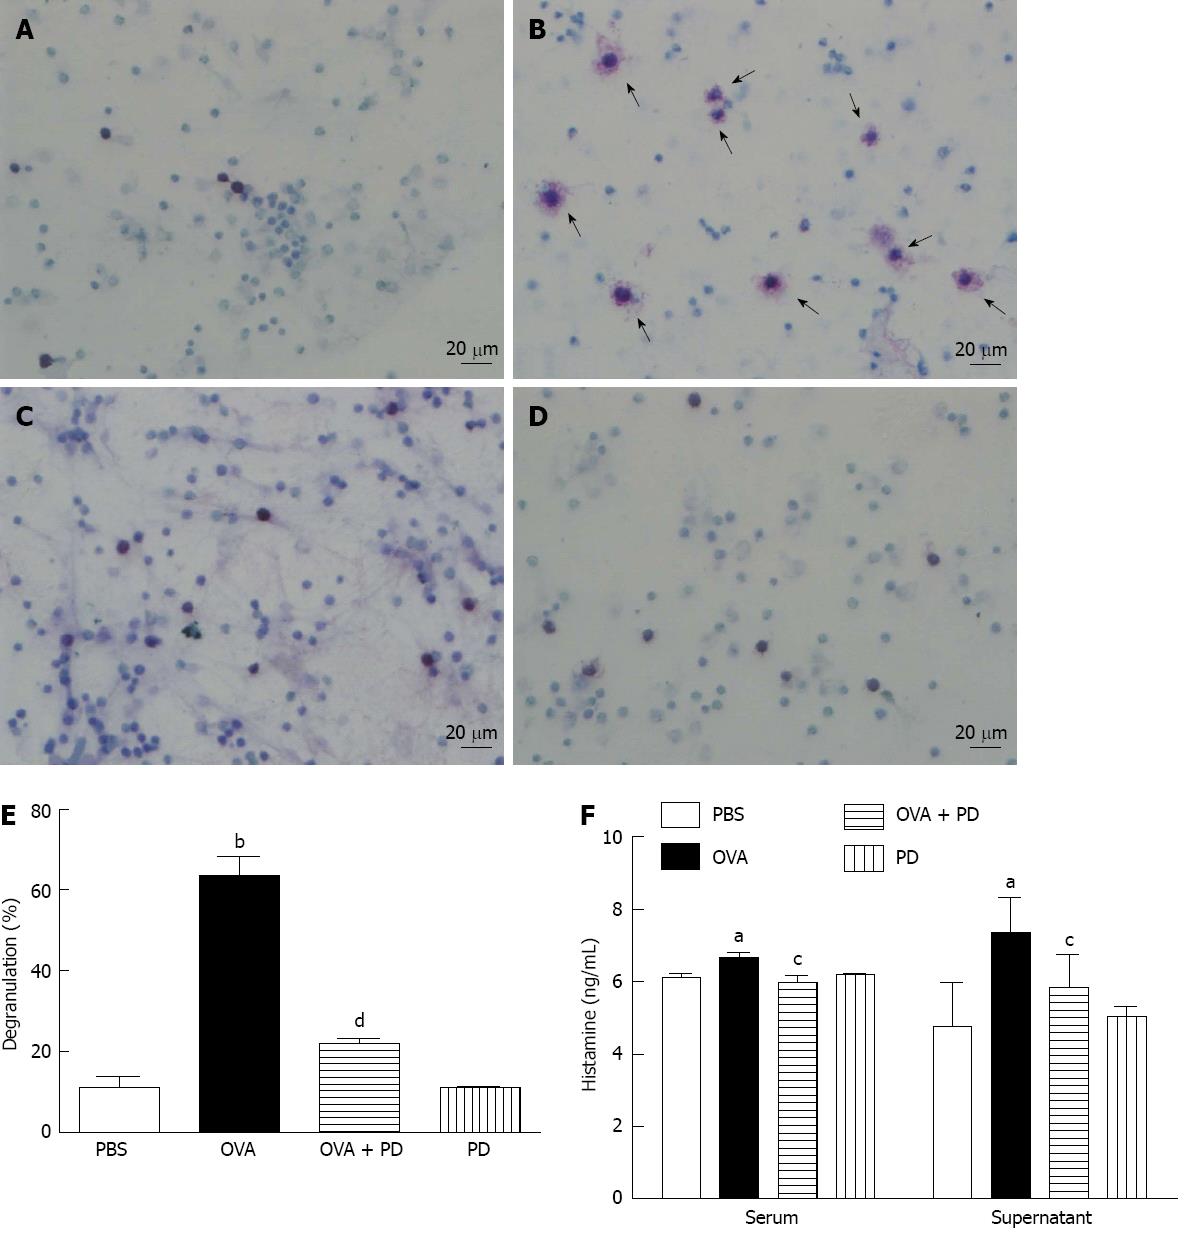
Figure 5 Polydatin therapy reduced mast cell degranulation and activation.
A: Phosphate-buffered saline (PBS) group; B: Ovalbumin (OVA) group; C: OVA + polydatin (PD) group; D: PD group; E: Degranulated mast cells were counted from at least 500 total cells and the percentage of degranulation was calculated as degranulated cells against total cells; F: The release of histamine in serum (left panel), rat small intestine tissue, or peritoneal lavage solution (right panel) was measured by enzyme-linked immunosorbent assay. n = 8, aP < 0.05, bP < 0.01 vs PBS group; cP < 0.05, dP < 0.01 vs OVA group. The mast cells in rat small intestine tissue or peritoneal lavage solution were identified by toluidine blue stain. Mast cells were considered degranulated if at least 5 granules appeared outside the cell body. Arrows indicate degranulated mast cells (magnification, × 250).
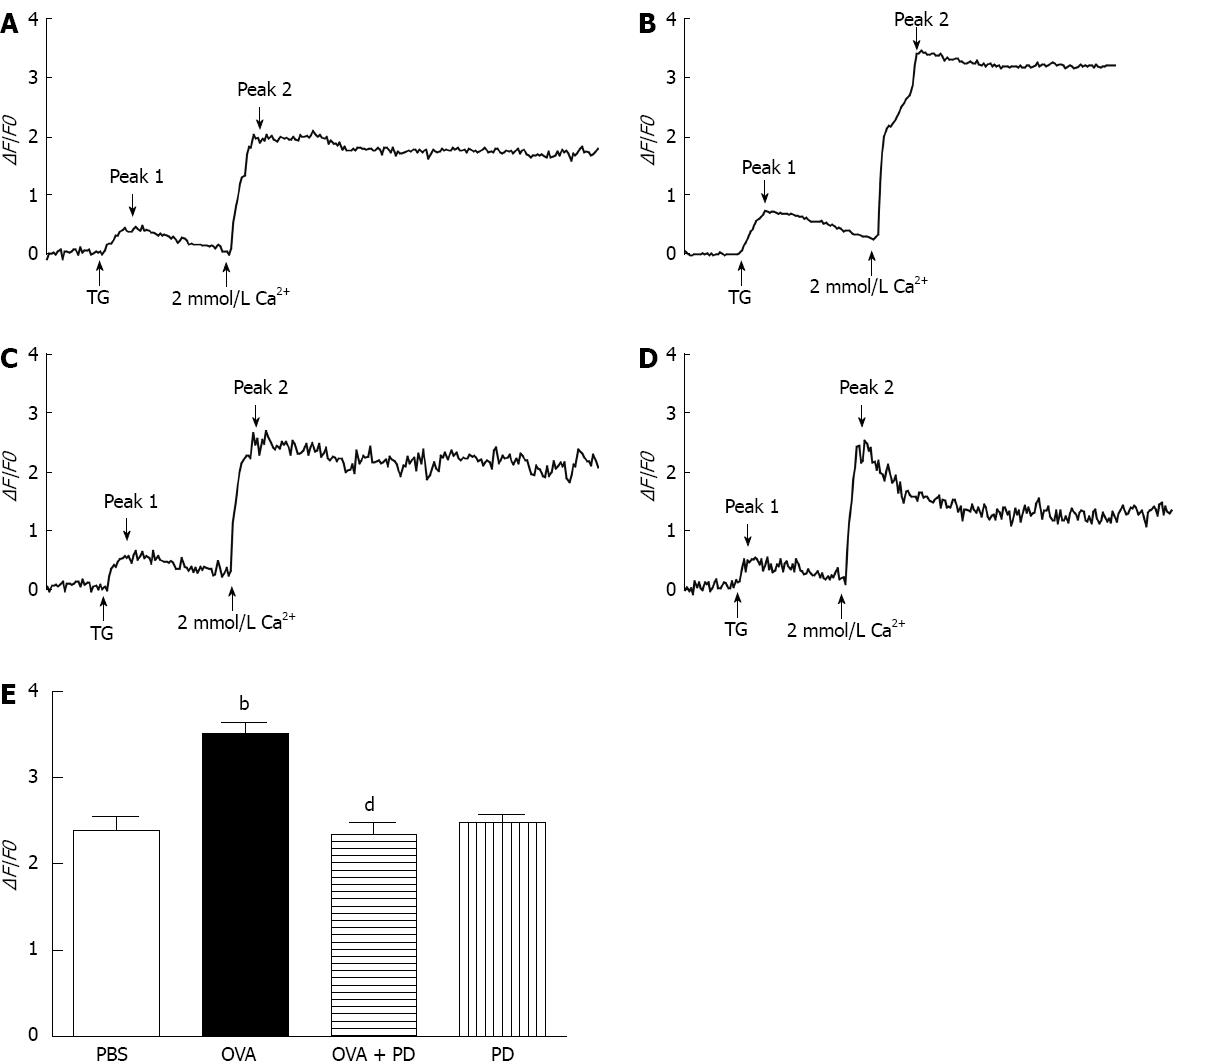
Figure 6 Polydatin reduced Ca2+ entry through store-operated calcium channels in food allergic mast cells.
Typical responses of thapsigargin (TG)-evoked Ca2+ entry through store-operated calcium channels in rat peritoneal mast cells (RPMCs). A: Phosphate-buffered saline (PBS) group; B: Ovalbumin (OVA) group; C: OVA + polydatin (PD) group; D: PD group; E: Averaged peak amplitude of Ca2+ entry (second peak) as recorded in each group. bP < 0.01 vs PBS group; dP < 0.01 vs OVA group. RPMCs were isolated from Brown-Norway rat treated with or without PD. Intracellular Ca2+ was indicated by a fluo-4 fluorescent probe. Total cell numbers are 40-50 for each group, and the cells were from four independent experiments.
-
Citation: Yang B, Li JJ, Cao JJ, Yang CB, Liu J, Ji QM, Liu ZG. Polydatin attenuated food allergy
via store-operated calcium channels in mast cell. World J Gastroenterol 2013; 19(25): 3980-3989 - URL: https://www.wjgnet.com/1007-9327/full/v19/i25/3980.htm
- DOI: https://dx.doi.org/10.3748/wjg.v19.i25.3980


