Copyright
©2013 Baishideng Publishing Group Co.
World J Gastroenterol. Jun 28, 2013; 19(24): 3831-3840
Published online Jun 28, 2013. doi: 10.3748/wjg.v19.i24.3831
Published online Jun 28, 2013. doi: 10.3748/wjg.v19.i24.3831
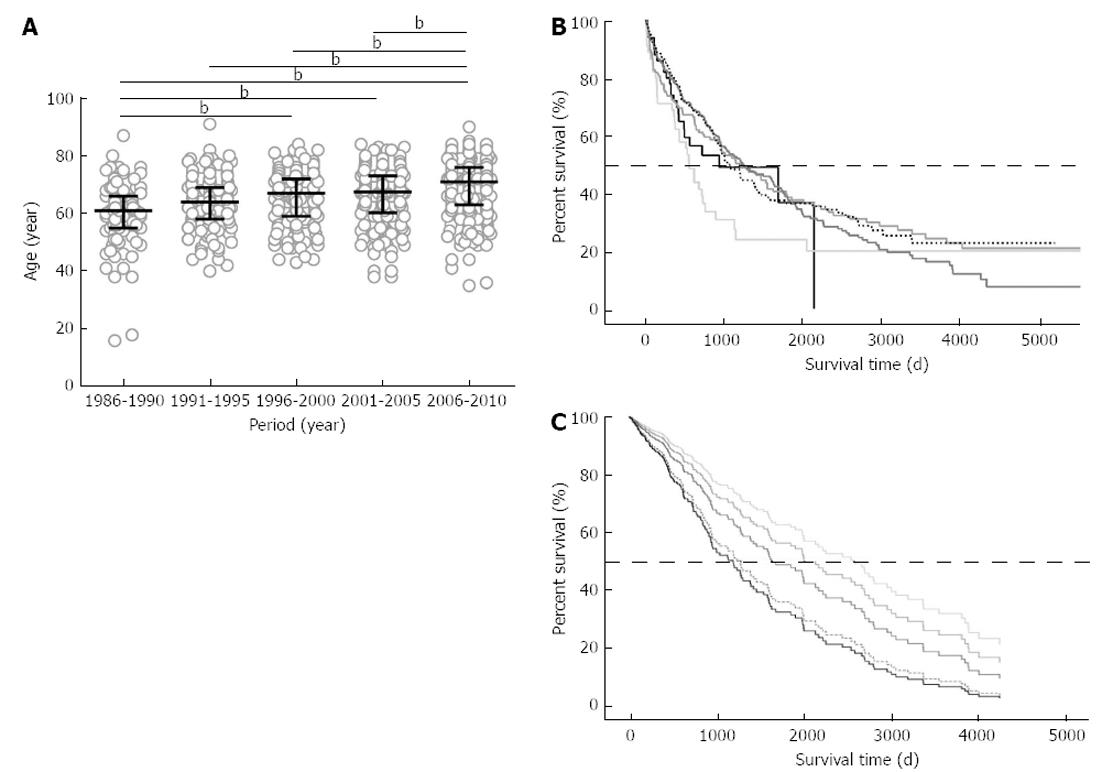
Figure 1 Age distribution in different periods and the survival of patients with hepatocellular carcinoma.
A: The age of patients who were admitted for the management of hepatocellular carcinoma was plotted for each 5-year interval since 1986: the median ages were significantly different among the different periods (P < 0.0001); B: The overall survival of 740 patients in five age groups who have already died or have been followed for longer than 1 year was calculated on the basis of Kaplan-Meier survival fractions: the median survival time of all cases was 1094 d; C: Overall survival was compared among the different age groups after compensation for background characteristics using a Cox proportional hazard model and was significantly different among age groups (P = 0.020). The solid black and dotted lines are the survival curves of the 80 years of age or older and 70-79 years of age groups, respectively. The other lines are 60-69 years of age, 50-59 years of age and 49 years of age or younger groups, indicated in colors ranging from dark to pale. bP < 0.01. The horizontal bars (A) indicate the median and interquartile range. The dotted horizontal lines (B and C) indicate a position of 50% survival.
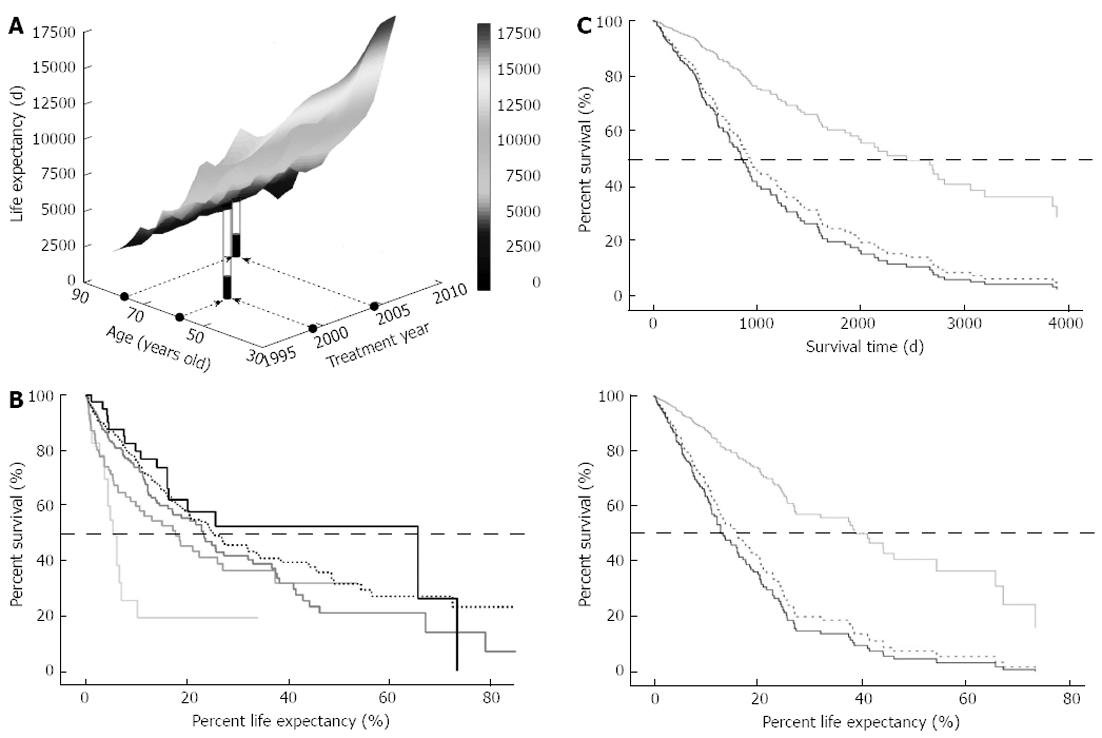
Figure 2 Life expectancy and percent life expectancy of patients with hepatocellular carcinoma.
A: Life expectancy (LE) for each case was plotted in a three-dimensional space. The percent LE (%LE) was defined as the ratio between survival time and LE and is shown for representative cases. The LE of a male at 59 years of age in the year 1999 is 7928 d, whereas the LE is 3760 d for a 77-year-old male in the year 2004 (white piles). Both patients survived for 1779 d, as indicated by the black piles, with %LE values of 22.4% and 48.6%, respectively; B: A survival proportion was expressed in %LE in the five different age groups, and the median %LE of all 504 cases was 22.9%. The solid black and dotted lines are the survival curves of 80 years of age or older and 70-79 years of age group, respectively. The other lines represent 60-69 years of age, 50-59 years of age and 49 years of age or younger groups, in colors ranging from dark to pale, respectively; C: In a cohort of 328 patients for whom LE is available, the survival among patients receiving loco-regional, interventional radiology (IVR), or chemotherapy (Cx) treatments was evaluated on the basis of absolute time (upper panel) or %LE (lower panel). The solid black and dotted lines are survival curves for Cx and IVR, respectively, and the gray line represents the loco-regional group. The dotted horizontal lines indicate a position of 50% survival.
Figure 3 Differences in survival and background characteristics by age groups.
A: In a cohort of 330 patients for whom life expectancy (LE) data are available, the survival of five different age groups was evaluated on the basis of absolute time (upper panel) or percent LE (lower panel). The solid black and dotted lines are the survival curves of the 80 years of age or older and 70-79 years of age groups, respectively. The other lines are 60-69 years of age, 50-59 years of age and 49 years of age or younger groups, indicated in colors ranging from dark to pale. The oldest group showed the worst survival in days but the best in percent LE; significantly better than that of the youngest group (P = 0.041); B: The distributions of Child-Pugh class (upper), tumor stage (middle), and hepatitis B surface antigen (HBsAg) positivity (lower) among three age groups: 59 years of age or younger, 60-79 years of age, and 80 years of age or older. For the hepatic reserve, the white, grey and black columns indicate Child-Pugh A, B and C classes, respectively, whereas tumor stages from I to IV are represented in order from white to black. The black column reveals that HBsAg was positive in the lower graph. There was no significant difference in terms of functional hepatic reserve among the three groups, although anatomical tumor extent and frequency of positive reaction for HBsAg were significantly higher in the youngest group as compared with the middle-aged group (P = 0.010 and P < 0.0001, respectively). The dotted horizontal lines indicate a position of 50% survival.
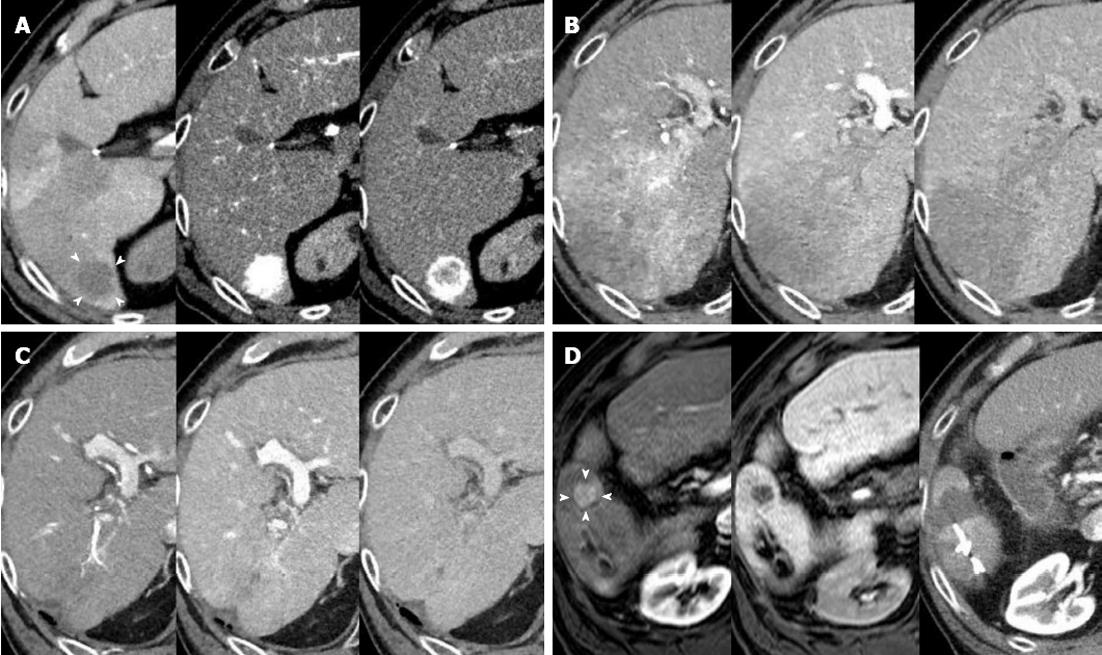
Figure 4 Representative follow-up images of successfully treated hepatocellular carcinoma in an elderly patient.
A: A classical hepatocellular carcinoma (HCC) was detected in segment 6 of the liver on April 12, 2009 as demonstrated by (1) a lower intensity up on computed tomography (CT) during arterial portography, indicated by arrowheads (left); (2) vigorous staining during the arterial phase of the CT during hepatic arteriography (middle); and (3) washout with a corona-like peripheral enhancement during the equilibrium phase of the CT during hepatic arteriography (right); B: A dynamic CT 25 mo after the initial radiofrequency ablation revealing recurrent HCCs, which had spread to large areas of segments 6 and 7 and extended to the main trunk of the right portal vein. The images were obtained during arterial, portal and equilibrium phases of the dynamic CT study, shown in order from left to right; C: After hepatic arterial infusion chemotherapy via a catheter using 5-fluorouracil and cis-diamminedichloroplatinum for 15 mo, an enormous tumor reduction, including the portal vein tumor thrombus, was achieved. The images were obtained during arterial, portal, and equilibrium phases of the dynamic CT study, shown in order from left to right; D: A new 10-mm lesion appeared in segment 6 during hepatic arterial infusion chemotherapy treatment, and a second radiofrequency ablation (RFA) was applied 41 mo after the initial RFA. Magnetic resonance imaging study using a contrast medium of gadolinium ethoxybenzyl diethylene-triamine-pentaacetic-acid showing the arterial supply (left, arrowheads) and a defect in the hepatobiliary phase (middle) of the study. An arterial phase image of the dynamic CT (right) obtained one day after RFA revealing that the ablated area of lower intensity included the target.
- Citation: Suda T, Nagashima A, Takahashi S, Kanefuji T, Kamimura K, Tamura Y, Takamura M, Igarashi M, Kawai H, Yamagiwa S, Nomoto M, Aoyagi Y. Active treatments are a rational approach for hepatocellular carcinoma in elderly patients. World J Gastroenterol 2013; 19(24): 3831-3840
- URL: https://www.wjgnet.com/1007-9327/full/v19/i24/3831.htm
- DOI: https://dx.doi.org/10.3748/wjg.v19.i24.3831


