Copyright
©2013 Baishideng Publishing Group Co.
World J Gastroenterol. Jun 28, 2013; 19(24): 3747-3760
Published online Jun 28, 2013. doi: 10.3748/wjg.v19.i24.3747
Published online Jun 28, 2013. doi: 10.3748/wjg.v19.i24.3747
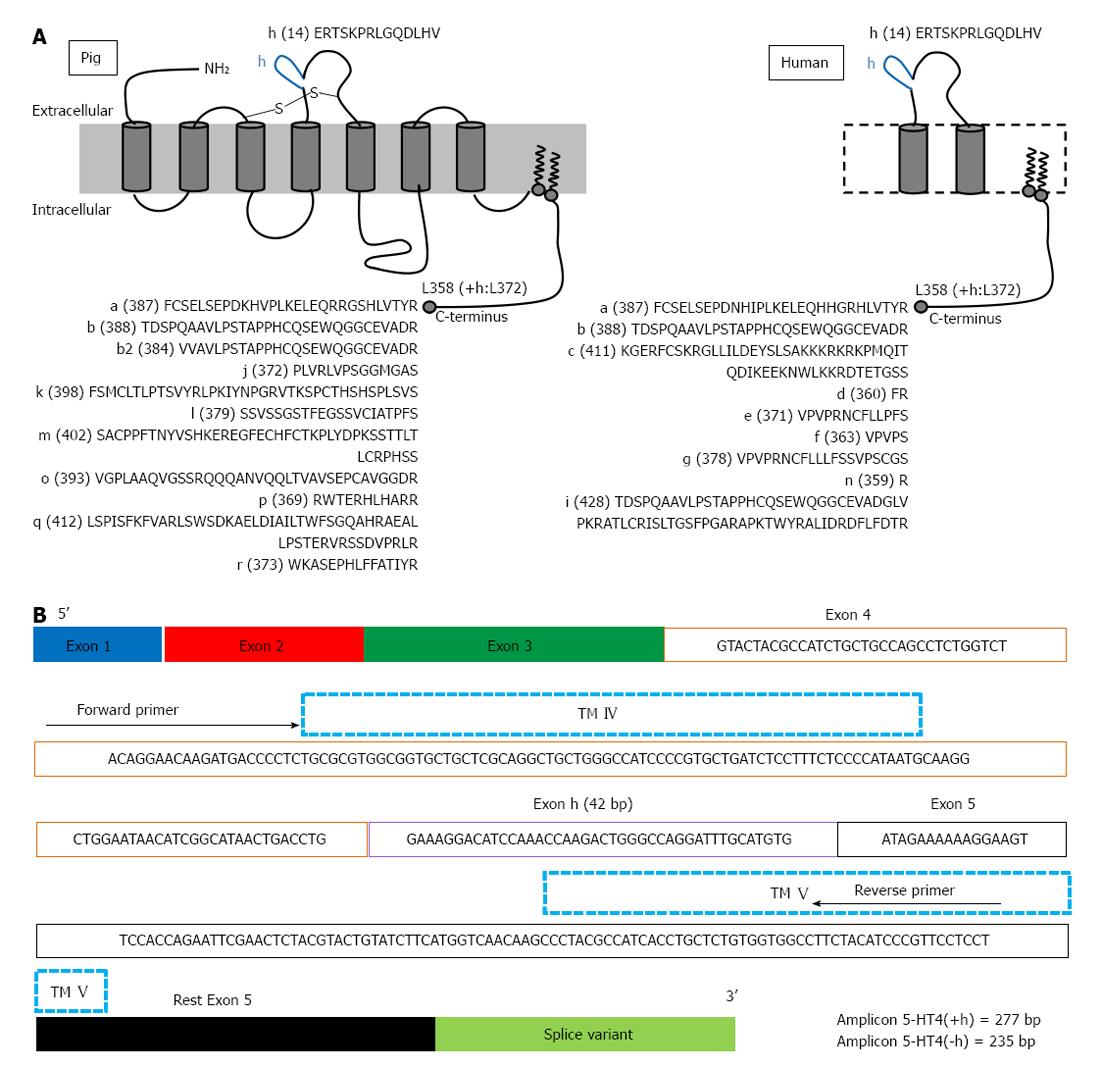
Figure 1 Schematic representation.
A: The porcine and human 5-HT4 receptor splice variants; B: cDNA of the porcine 5-HT4(hb) receptor based on gene browsing (transcript ID: ENSSSCT00000015770 on http://www.ensembl.org/Sus_scrofa/Gene). The 5-HT4 receptor variants have identical sequences up to Leu358, or Leu372 when exon h is included, and differ by the length and composition of their C-terminal domain. The presence of the h sequence of 14 amino acids in the second extracellular loop depends on the all or none inclusion of exon h between exon 4 and 5. The positions of the boundaries in between exons, the transmembrane (TM) domains IV and V and the positions of primers used in this study are indicated. The primers will detect all 5-HT4 receptor splice variants. Amplification will result in a 277 bp amplicon, when containing the 42 bp h-exon or a 235 bp amplicon, not containing the h-exon.
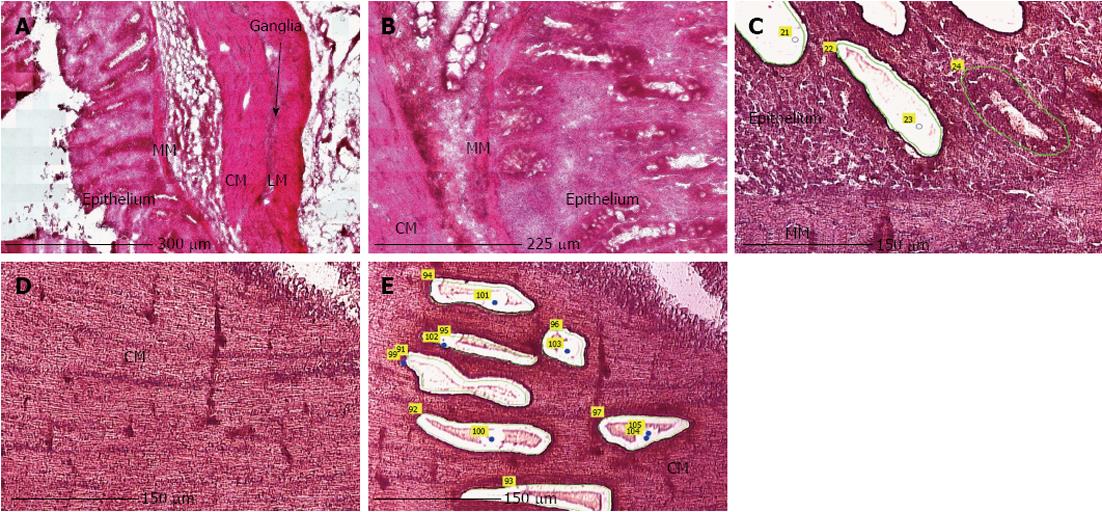
Figure 2 Photomicrographs of hematoxylin and eosin stained tissue sections of colon descendens: epithelium, muscularis mucosae, circular muscle layer, longitudinal muscle layer and ganglion.
A: Overview of all layers in colon descendens; B: Detail of the epithelium; C: Epithelium with large patches microdissected by LMPC; D: Details of CM; E: CM with large patches of smooth muscle cells microdissected by LMPC. MM: Muscularis mucosae; CM: Circular muscle layer; LM: Longitudinal muscle layer; LMPC: Laser microdissection and pressure catapulting.
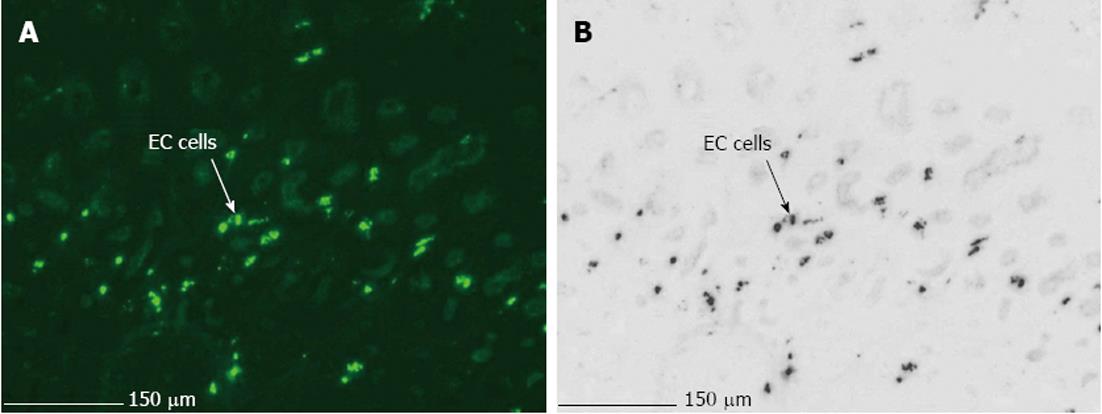
Figure 3 Photomicrographs of immunohistologically stained 8 μm sections of pig gastric fundus showing.
A: MAB352 (1:200) immunofluorescent enterochromaffin cells (EC) in the epithelium (× 20); B: Invert color visualization of MAB352 (1:200) immunofluorescent EC cells.
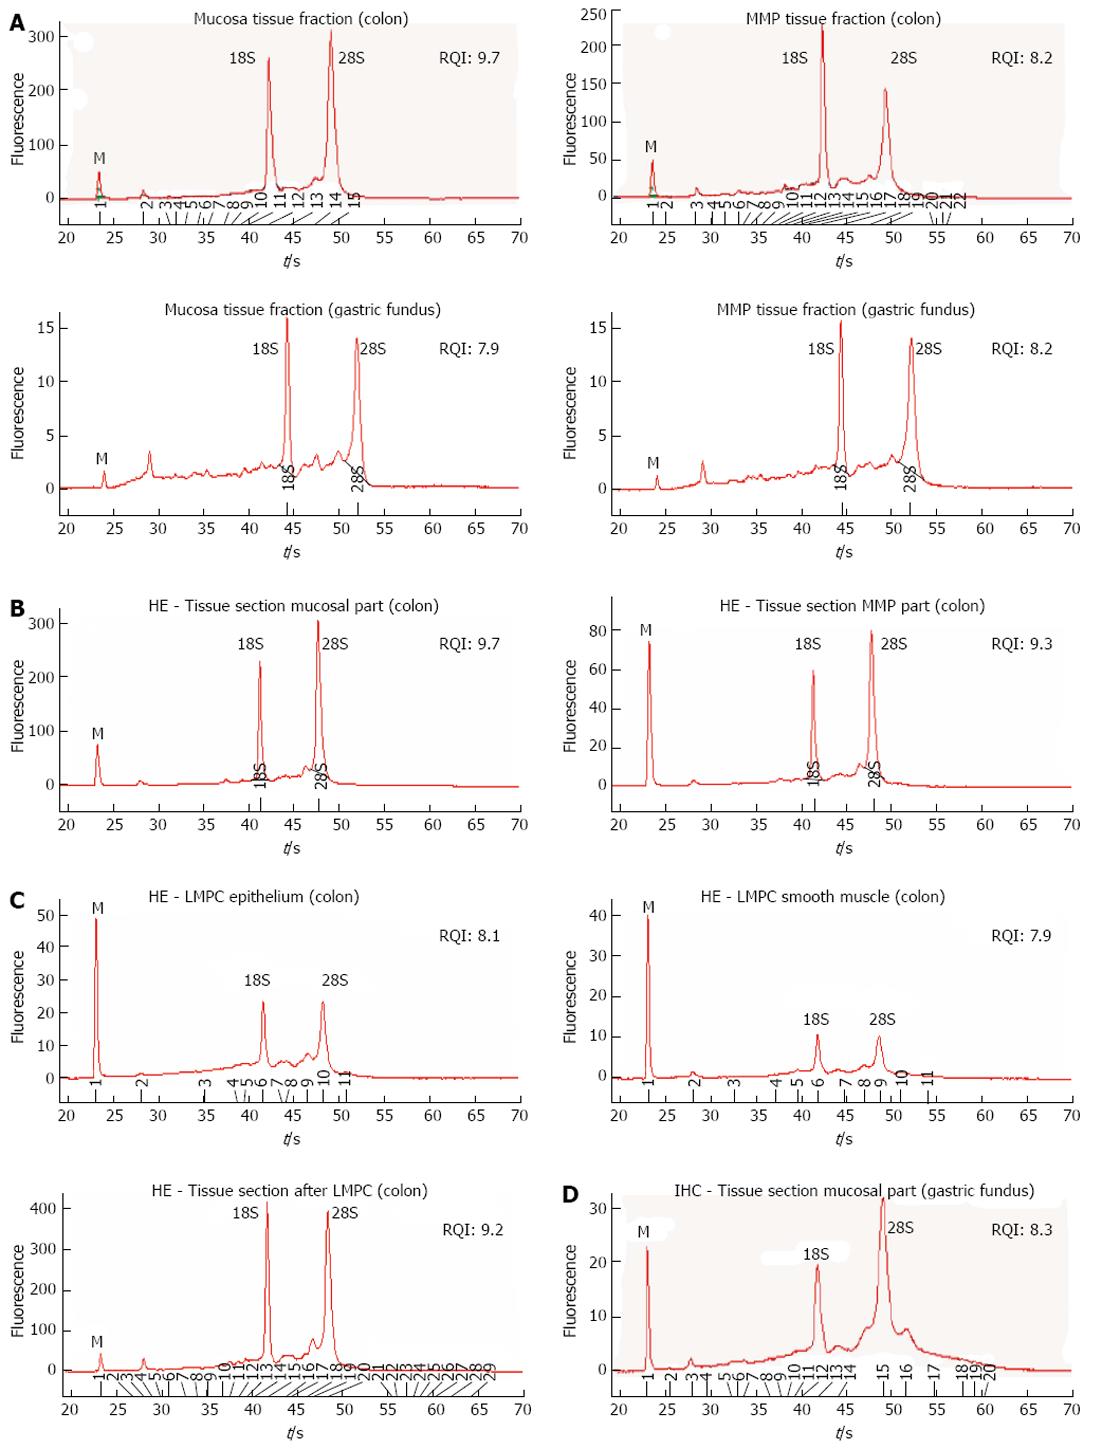
Figure 4 Representative experion electropherograms of collected RNA.
A: Mucosa and MMP tissue fractions of colon descendens and gastric fundus; B: The mucosal part and the MMP part of HE stained tissue sections of colon descendens; C: Large patches of epithelial cells and smooth muscle cells obtained by LMPC from HE stained tissue sections and the whole HE stained tissue section scraped off after LMPC in colon descendens; D: The mucosal part of an IHC stained tissue section of gastric fundus. Electropherograms show fluorescence (ordinate) vs time (abscissa) with RQI values. Positions of 18S and 28S ribosomal RNA and marker (M) peaks are indicated. MMP: Muscle-myenteric plexus; HE: Hematoxylin and eosin; IHC: Immunohistochemically; RQI: RNA quality indicator.
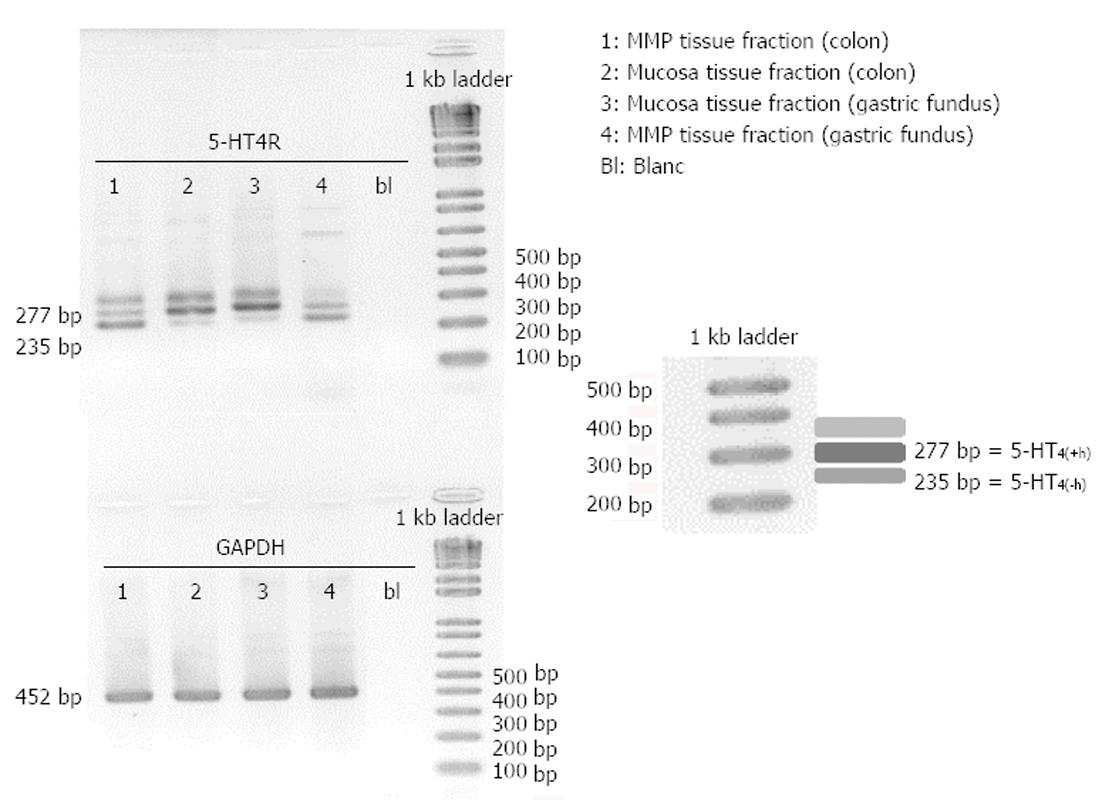
Figure 5 Invert color image of endpoint polymerase chain reaction analysis of the 5-HT4 receptor and of the glyceraldehyde-3-phosphate dehydrogenase housekeeping gene expressed in mucosa and muscle-myenteric plexus tissue fractions of pig colon descendens and gastric fundus.
Dominant expression of 5-HT4(+h) receptor in the mucosa of the colon descendens and gastric fundus is observed. Part of the ladder is increased to indicate the size of the expected polymerase chain reaction (PCR) products. A third unknown upper band is shown above the 277 bp band, due to dimerization of the PCR product with other PCR fragments after the PCR reaction. GAPDH: Glyceraldehyde-3-phosphate dehydrogenase; MMP: Muscle-myenteric plexus.
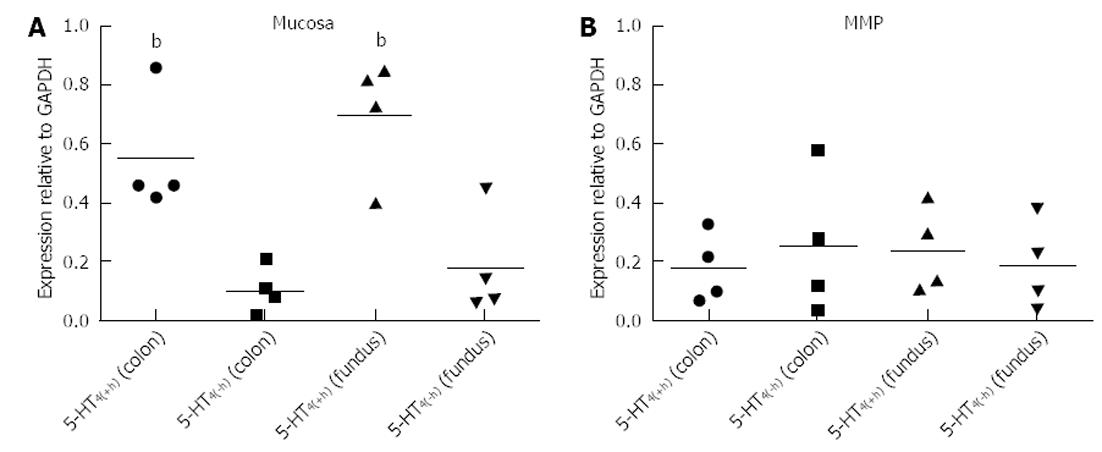
Figure 6 Expression of 5-HT4(+h) and 5-HT4(-h) receptors in the mucosa (A) and muscle-myenteric plexus (B) fractions of colon descendens and gastric fundus.
Data are given as ratio relative to glyceraldehyde-3-phosphate dehydrogenase (GAPDH) expression. The line indicates the mean of n = 4 for each region-fraction. bP < 0.01 vs values for 5-HT4(-h) receptors in colon descendens or gastric fundus. MMP: Muscle-myenteric plexus.
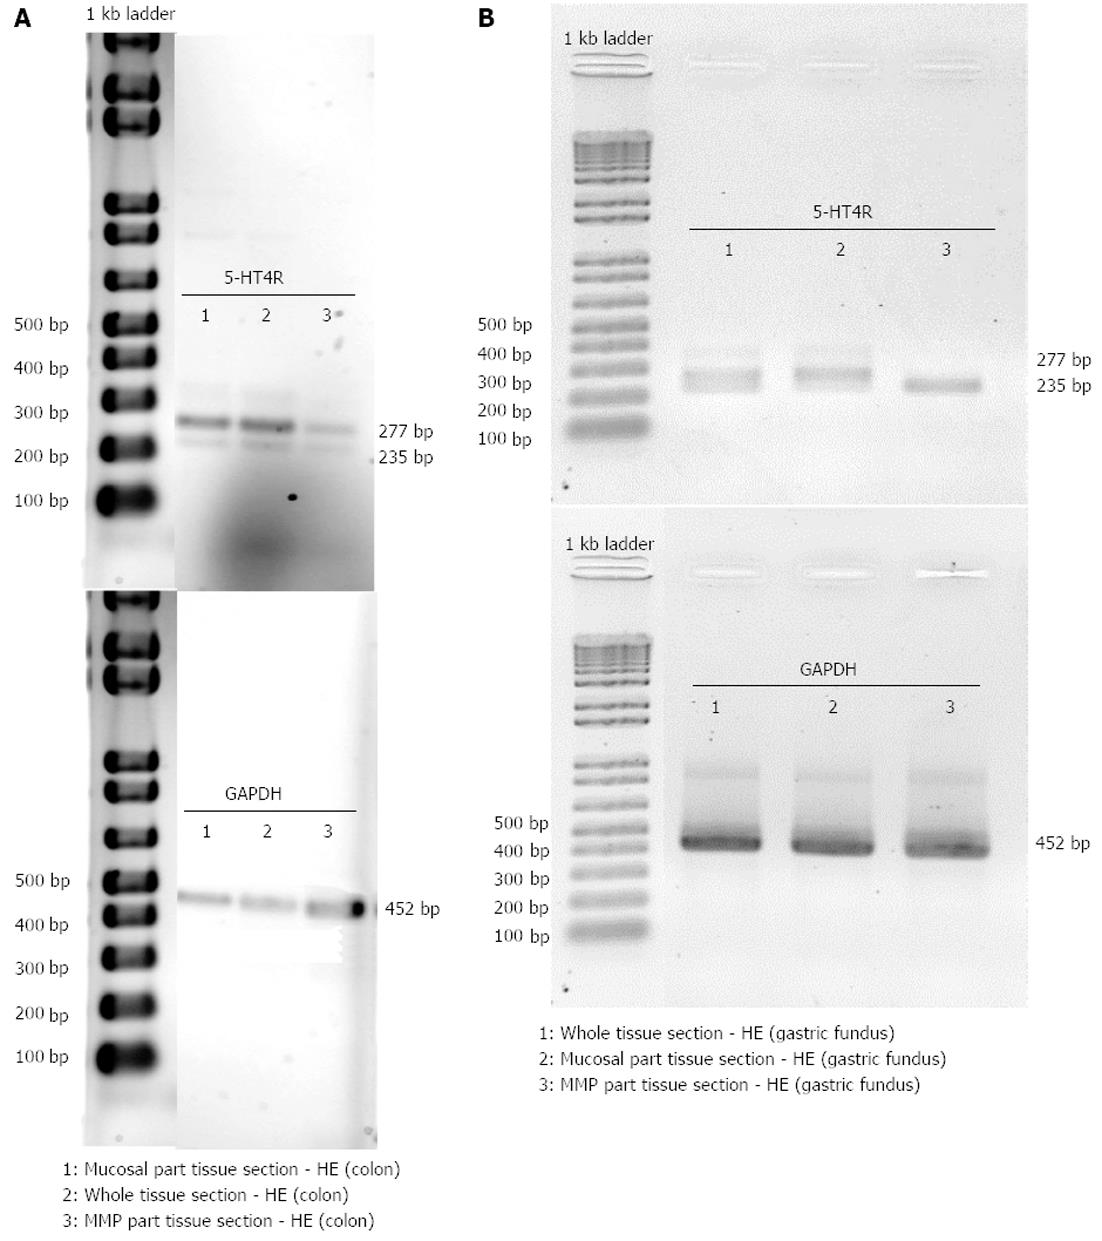
Figure 7 Invert color image of endpoint polymerase chain reaction analysis.
5-HT4 receptor and glyceraldehyde-3-phosphate dehydrogenase (GAPDH) expression is shown in a hematoxylin and eosin (HE) stained whole tissue section, and in the mucosal as well as the muscle-myenteric plexus (MMP) part of a HE stained tissue section of colon descendens (A) and gastric fundus (B). The size of the expected polymerase chain reaction products is indicated.
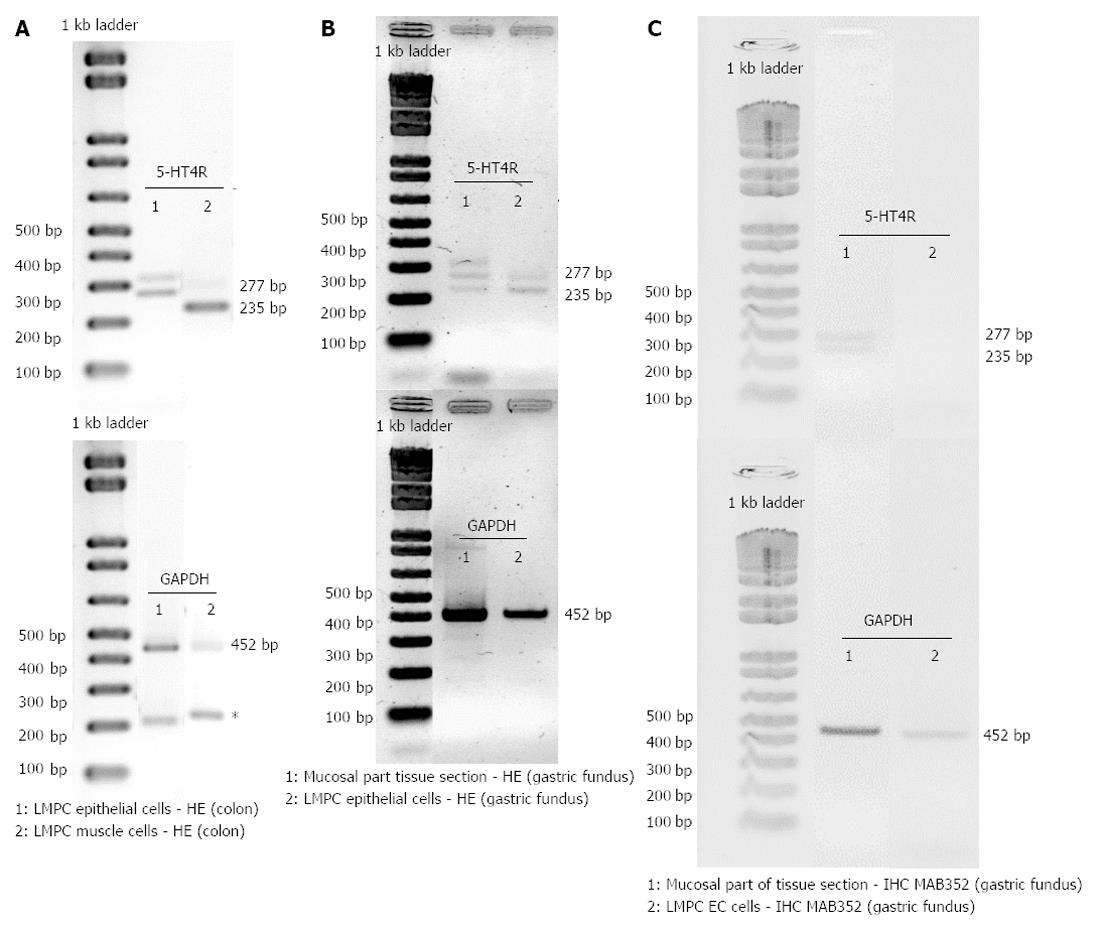
Figure 8 Invert color representation of the double round of endpoint polymerase chain reaction analysis.
A, B: 5-HT4 receptor and glyceraldehyde-3-phosphate dehydrogenase (GAPDH) expression is shown in large patches of epithelium cells and smooth muscle cells obtained by laser microdissection and pressure catapulting (LMPC) from hematoxylin and eosin (HE) stained tissue sections of colon descendens (A) and gastric fundus (B, only epithelial cells were obtained), and in enterochromaffin cells obtained by LMPC from MAB352 immunohistochemical (IHC) stained tissue sections of gastric fundus (C). For comparison, the result obtained in the mucosal part of the HE or IHC stained tissue section of gastric fundus is also shown in B and C. The size of the expected polymerase chain reaction products and presence of non-specific amplification are indicated (asterisk).
- Citation: Priem EK, Maeyer JHD, Vandewoestyne M, Deforce D, Lefebvre RA. Predominant mucosal expression of 5-HT4(+h) receptor splice variants in pig stomach and colon. World J Gastroenterol 2013; 19(24): 3747-3760
- URL: https://www.wjgnet.com/1007-9327/full/v19/i24/3747.htm
- DOI: https://dx.doi.org/10.3748/wjg.v19.i24.3747


